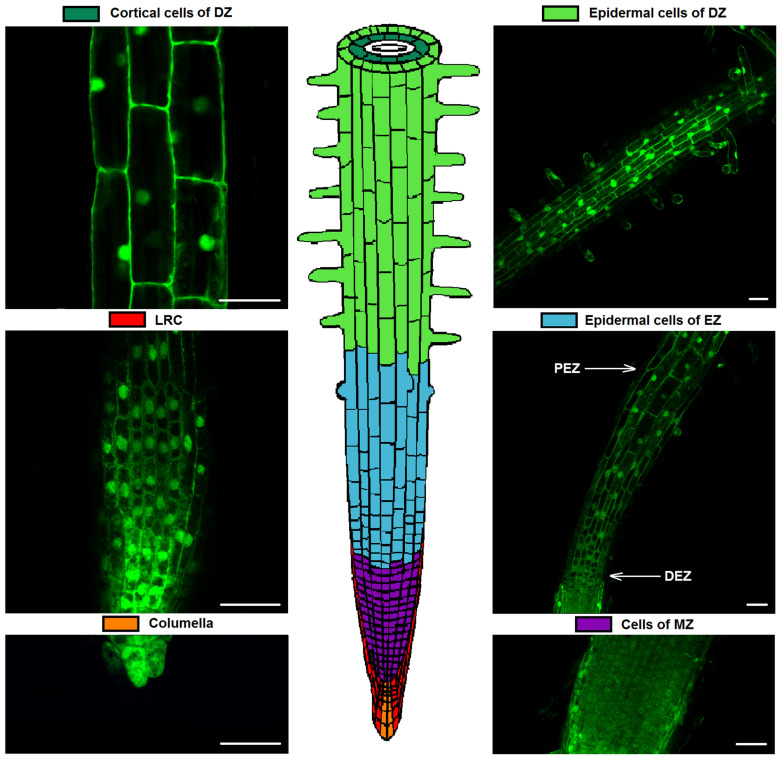
Figure 3.
The scheme of tobacco root with LSM images of studied root cells of transgenic tobacco plants. LSM images (λem 505–525nm) with excitation λex 488 nm are represented. DZ, differentiation zone; LRC, lateral root cap cells; EZ, elongation zone; DEZ; distal cells of elongation zone; PEZ, proximal cells elongation zone; MZ, meristem zone. Scale bar, 50 μm.

