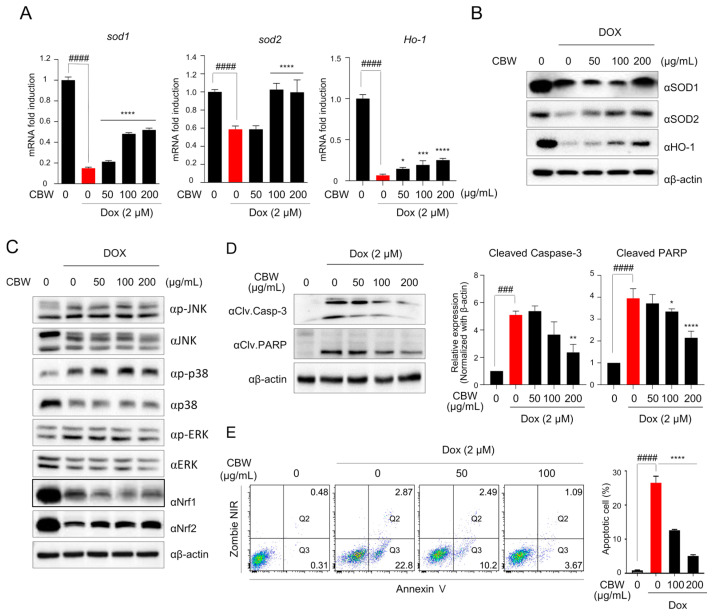
Figure 4.
CBW prevents DOX-induced apoptotic cell death through Nrf2-mediated SOD activation in H9c2 cells. (A,B) CBW increased SOD1, SOD2, and HO-1 expression following DOX treatment in H9c2 cells. The results were demonstrated as the relative fold change with respect to the control values, and the values are presented as mean ± SD of three independent experiments. The means with different superscript letters are significantly different. #### p < 0.0001 (control vs. DOX) (Student’s t-test); * p < 0.05, *** p < 0.001, and **** p < 0.0001 (DOX vs. CBW) (one-way ANOVA) (A). Total protein was extracted from the cells and used for immunoblot assay (B). (C) CBW reversed DOX-induced Nrf2 reduction in H9c2 cells. Total protein was extracted from the cells and then used for immunoblot analysis. (D) CBW decreased the cleavage of caspase-3 and PARP in H9c2 cells. Total lysates were used for immunoblot analysis (left panel). Band intensities were quantified using Fusion analysis software (Ver. 16.07). The quantified expression was normalized with respect to that of the internal control, β-actin (right panel). The values are presented as mean ± SD of three independent experiments. The means with different superscript letters are significantly different. ### p < 0.001 and #### p < 0.0001 (control vs. DOX) (Student’s t-test); * p < 0.05, ** p < 0.01, and **** p < 0.0001 (DOX vs. CBW) (one-way ANOVA). (E) CBW blocked DOX-induced apoptosis of H9c2 cells. The rate of apoptosis was calculated as the percentage of apoptotic cells in 5 × 10⁴ cells analyzed in each of three independent experiments. The number in the corner of the Q3 or Q2 quadrant indicates the percentage of early or late apoptosis, respectively (left panel). The sum of the percentage of apoptotic cells is presented in bar graphs (right panel). The values are presented as mean ± SD of three independent experiments. The means with different superscript letters are significantly different. #### p < 0.0001 (control vs. DOX) (Student’s t-test); **** p < 0.0001 (DOX vs. CBW) (one-way ANOVA).

