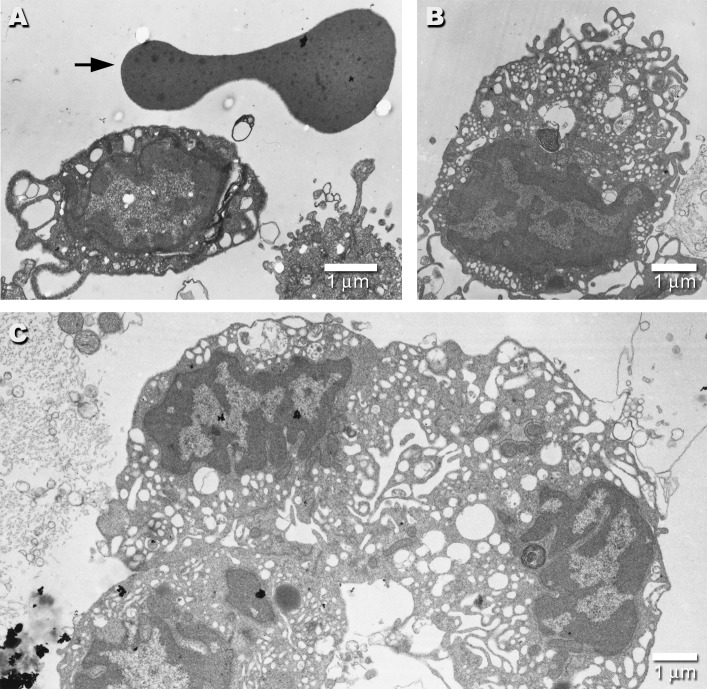
Figure 1. EMs of Day 0 Spoc Cells.
Electron micrograph of a freshly isolated Spoc cell (A) shows its small size relative to the typical biconcave profile of the red blood cell above it (arrow). (B) shows a typical Spoc cell with a large number of vesicular structures, lamellipodia, and filopodia. (C) displays three Spoc cells so tightly clumped that their borders are difficult to distinguish. This typical clumping makes fluorescence-activated cell sorting (FACS) analysis difficult.

