FIGURE 3.
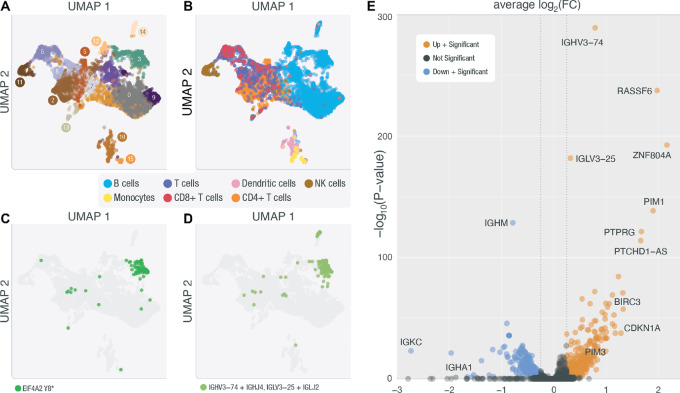
snRNA-seq of Patient HL-248. A, UMAP representation of unsupervised clustering of nuclei sequenced in HL-248. B, UMAP of HL-248 clusters with cell-type labels determined by celldex and SingleR. C, UMAP of HL-248 where highlighted nuclei are nuclei with a VAF > 0 for the EIF4A2 variant uncovered in this sample's deep exome (chr3:186783634 T/A). D, UMAP of HL-248 where highlighted nuclei are nuclei that express an expanded BCR clonotype. E, Genes differentially expressed between cluster 3 and all other B cells are displayed as either downregulated with a significant P value (blue) or upregulated with a significant P value (orange).

