FIGURE 4.
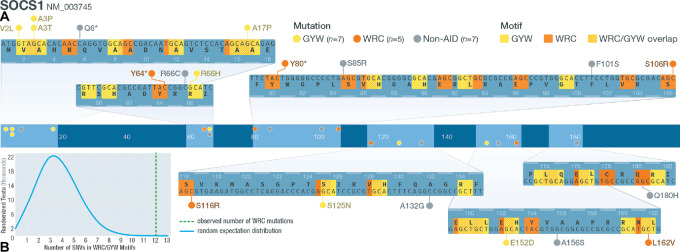
Mutations in AID motifs at SOCS1. A, Schematic of SOCS1 gene structure. Middle track shows where SOCS1 SNVs are located. Zoomed-in tracks (top and bottom) show the location of WRC/GYW motifs and the mutations that lie within or outside motifs (W = A/T; R = A/G; Y = C/T). B, Distribution of counts of simulated mutations observed at SOCS1 that were in WRC motifs. The actual observed number of WRC SNVs (12/19) is shown using a green dashed line.

