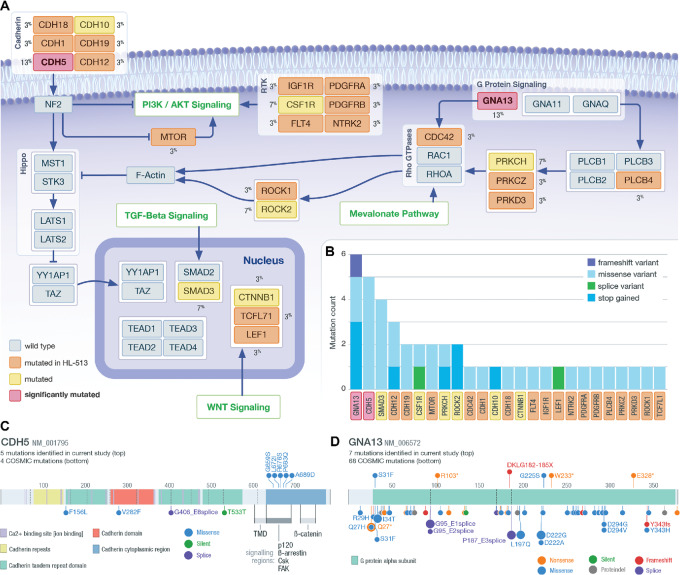
FIGURE 6.
Regulating Hippo. A, Diagram of pathways that regulate Hippo signaling. Identified SMGs are shown in red; genes mutated in at least one non-hypermutated sample are shown in yellow; genes only mutated in the hypermutated sample (HL-513) are shown in orange. The gene mutation frequency across the cohort is shown as a percent. The pathways labeled in green indicate larger pathways not shown in this diagram. B, The total number and type of mutation observed are shown in the inset bar chart. C, Lolliplot of CDH5; mutations identified in the current study are shown on the top and COSMIC mutations found in lymphoid tissue on the bottom. D, Lolliplot of mutations identified at GNA13; mutations identified in the current study are shown on the top and COSMIC mutations found in lymphoid tissue on the bottom.

