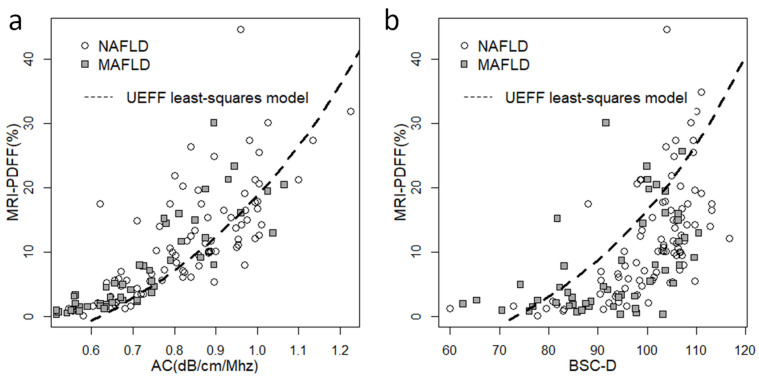
Figure 1.
Scatter plots showing the correlation between quantitative ultrasound (QUS) biomarkers and MRI-PDFF. (a) We observed a non-linear distribution of the attenuation coefficient (AC) and (b) the backscatter-distribution coefficient (BSC-D) in relation to MRI-PDFF, in both the non-alcoholic fatty liver disease (NAFLD, empty circle) and the metabolic-associated fatty liver disease (MAFLD, gray square) groups. We fitted a non-linear least squares model (dashed line) onto the NAFLD dataset using a combination of AC and BSC-D values to compensate for the saturation effect at higher fat fractions.

