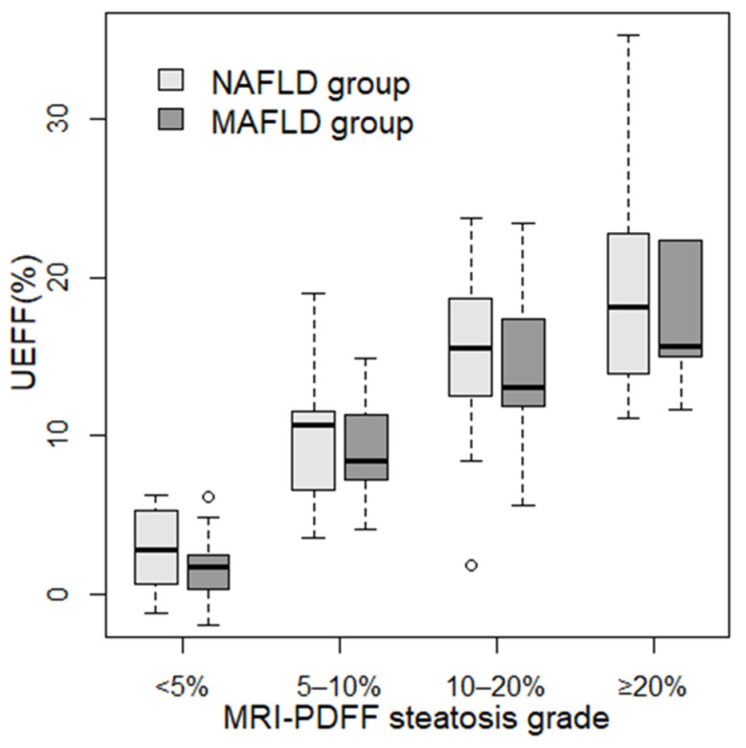
Figure 3.
Distribution of UEFF across steatosis grades. Patients were classified into four steatosis severity grades based on MRI-PDFF using cutoff values at 5%, 10%, and 20% fat fractions. The box plots represent the median (thick line), the range between 25% and 75% percentiles (box), and the minimum and maximum values (whiskers) of UEFF predicted with the combined least squares model for patients in each grade. Two sets of box plots were calculated, one for non-alcoholic fatty liver disease (NAFLD, light gray), and another for metabolic-associated fatty liver disease (MAFLD, dark gray).

