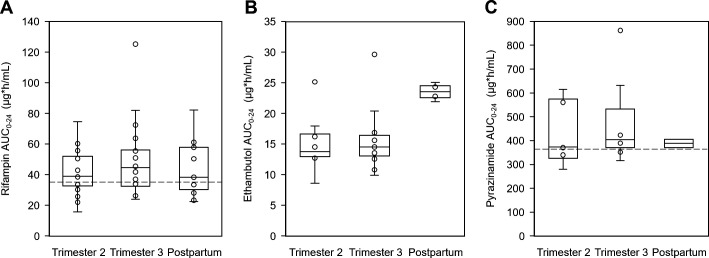
Fig 2.
Box and whisker plots showing plasma AUC0-24 of (A) rifampin, (B) ethambutol, and (C) pyrazinamide during the second and third trimesters and postpartum (median, IQR, and range). The dots represent additional individual values. The minimum target AUC0-24 of rifampin and pyrazinamide is represented by the dashed lines.

