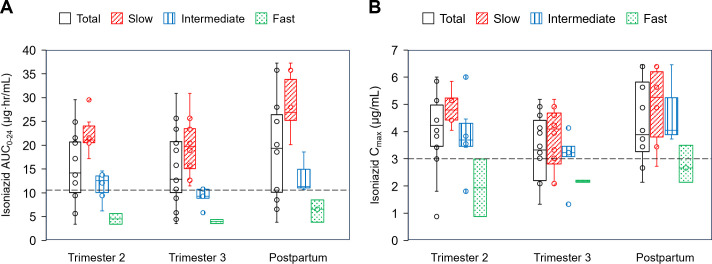
Fig 3.
Box and whisker plots showing plasma isoniazid (A) AUC0-24 and (B) C max for the total group and per metabolizer type during the second and third trimesters and postpartum (median, IQR, and range). The dots represent additional individual values. The minimum target AUC0-24 and C max are represented by the dashed lines.

