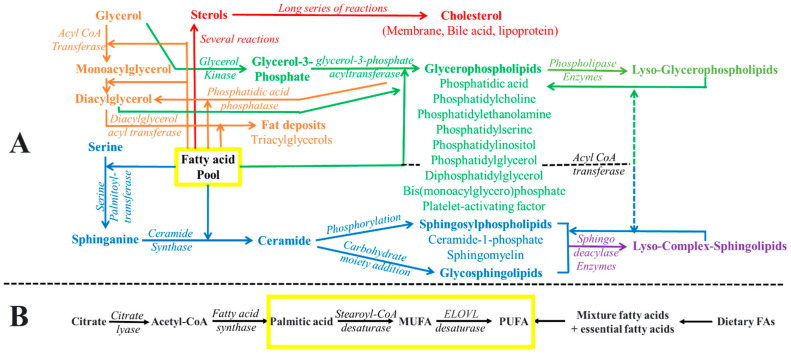
Figure 6.
Schematic representation of (A) fatty acids incorporated into various lipids and (B) the origins of fatty acid pool formation (the de novo pathway and dietary sources). The depiction employs color coding to symbolize distinct metabolic pathways. The yellow box designates the fatty acid pool, signifying its integration into diverse membrane lipids. The brown shade denotes processes related to non-membrane and non-polar lipid formation. The red color represents the metabolic routes responsible for sterol production. Additionally, the green color signifies the integration of fatty acids into various phospholipids, while the blue hue corresponds to the incorporation of fatty acids into diverse sphingolipids.

