Figure 4.
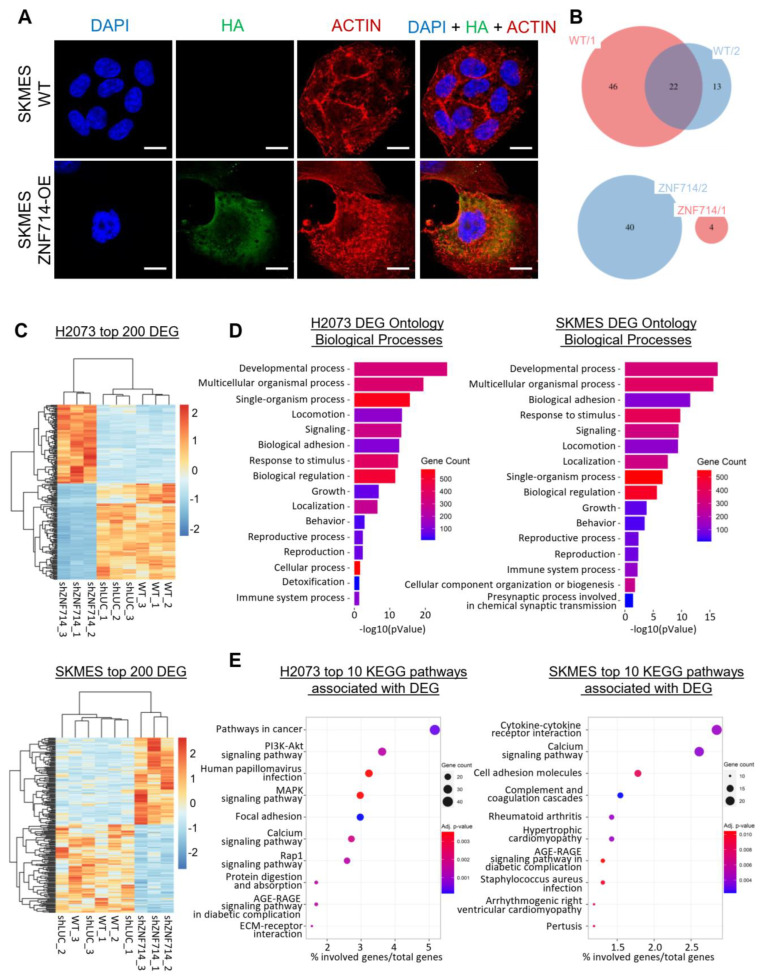
Transcriptomic profile of lung cancer cells with silenced expression of ZNF714. (A) ZNF714 localization in SKMES WT and ZNF714-OE cells. Confocal microscopy pictures of anti-HA antibody connected with Alexa Fluor®488-conjugated anti-rabbit secondary antibody and DyLight 650-labeled anti-actin antibody. Nuclei were stained with DAPI. Olympus Scanning Confocal Microscope FV1000, 60×. The scale bar represents 10 μm. (B) The number of identified peaks in SKMES WT and ZNF714-OE within two replicates in ChIP-seq analysis. (C) Z-score normalized heatmaps and supervised clustering representing top 200 (sorted by p-value) differentially expressed genes (DEGs) between control cells (WT and shLUC) and shZNF714 cells for H2073 (top) and SKMES (bottom). The cutoff threshold was fc ≥ 2 or ≤−2, p < 0.05. (D) Barplots showing enrichment of biological processes (BP1) in all DEGs identified for H2073 (left) and SKMES (right). The color scale represents the number of DEGs involved in each process. (E) Bubble plots representing the top 10 KEGG pathways (sorted by p-value) associated with DEGs. X-axis represents the ratio of genes involved in each pathway relative to all DEGs. The color scale indicates the p-value, and the bubble size represents the number of genes involved in each pathway.

