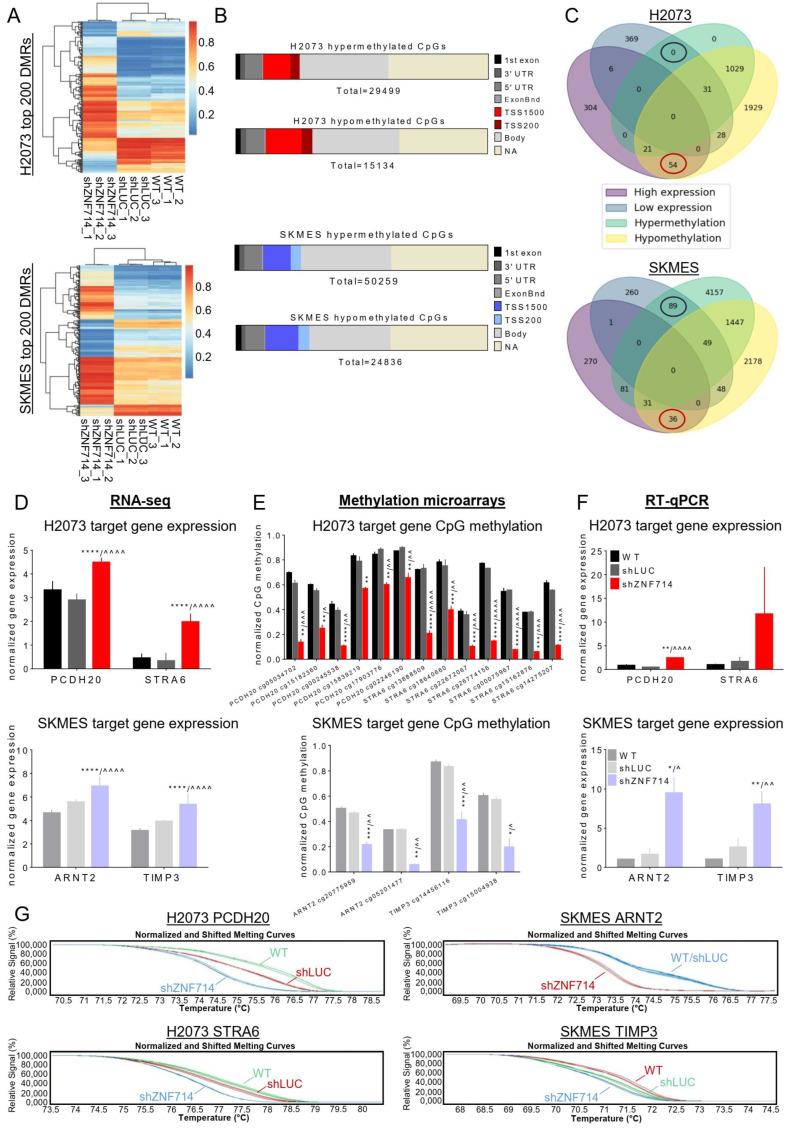
Figure 5.
ZNF714 inactivates tumor suppressor genes via DNA methylation. (A) Heatmap and hierarchical clustering of top 200 differentially methylated regions (DMRs) (sorted by p-value) for H2073 (top panel) and SKMES (bottom panel). The color scale represents delta mean values. (B) Bars represent the distribution of hyper- and hypomethylated CpGs across different genome parts. Horizontal slices represent the percentage of CpGs in each region related to all differentially methylated CpGs for each cell line separately. TSS200/TSS1500–distance (in base pairs) from transcription start site. (C) Venn diagram integrating DMRs and DEGs in H2073 and SKMES cell lines. Hypo- and hypermethylation refers to cytosines in the TSS gene region. (D) Normalized expression of selected ZNF714 target genes in RNAseq analysis. (E) Differentially methylated CpGs within the TSS region of selected target genes evaluated by methylation microarray. (F) RT-qPCR analysis of selected target gene expression. The experiment was performed in biological and technical triplicates. Statistical analysis was performed with an unpaired t-test. */^ p ≤ 0.05; **/^^ p ≤ 0.01; ***/^^^ p ≤ 0.001; ****/^^^^ p ≤ 0.0001. * vs. WT, ^ vs. shLUC. (G) MS-HRM analysis of DNA methylation within the promoter region of selected target genes. The experiment was performed in biological and technical triplicates. The figure shows representative normalized and shifted melting curves for each gene.

