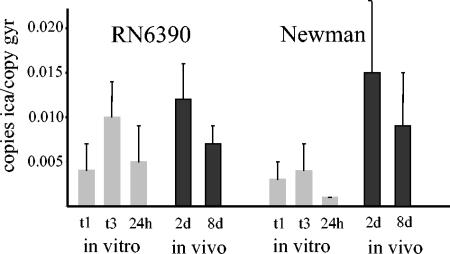
FIG. 6.
Quantitative transcript analysis of S. aureus RN6390 and S. aureus Newman by LightCycler RT-PCR in vitro and in vivo. ica transcripts were quantified in relation to the number of gyr transcripts in each sample. Transcription of ica was determined in the mid-exponential phase (time 1 [t1]) and in the late-exponential phase (t3), as well as after 24 h of growth in CYPG (gray columns) and in exudates from infected devices in guinea pigs 2 days (2d) and 8d after bacterial inoculation (black columns). Values from three separate RNA preparations were used to calculate the mean values ± standard deviations.

