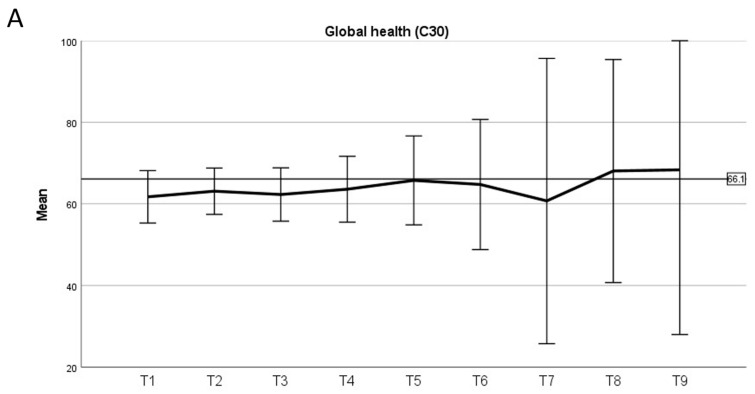
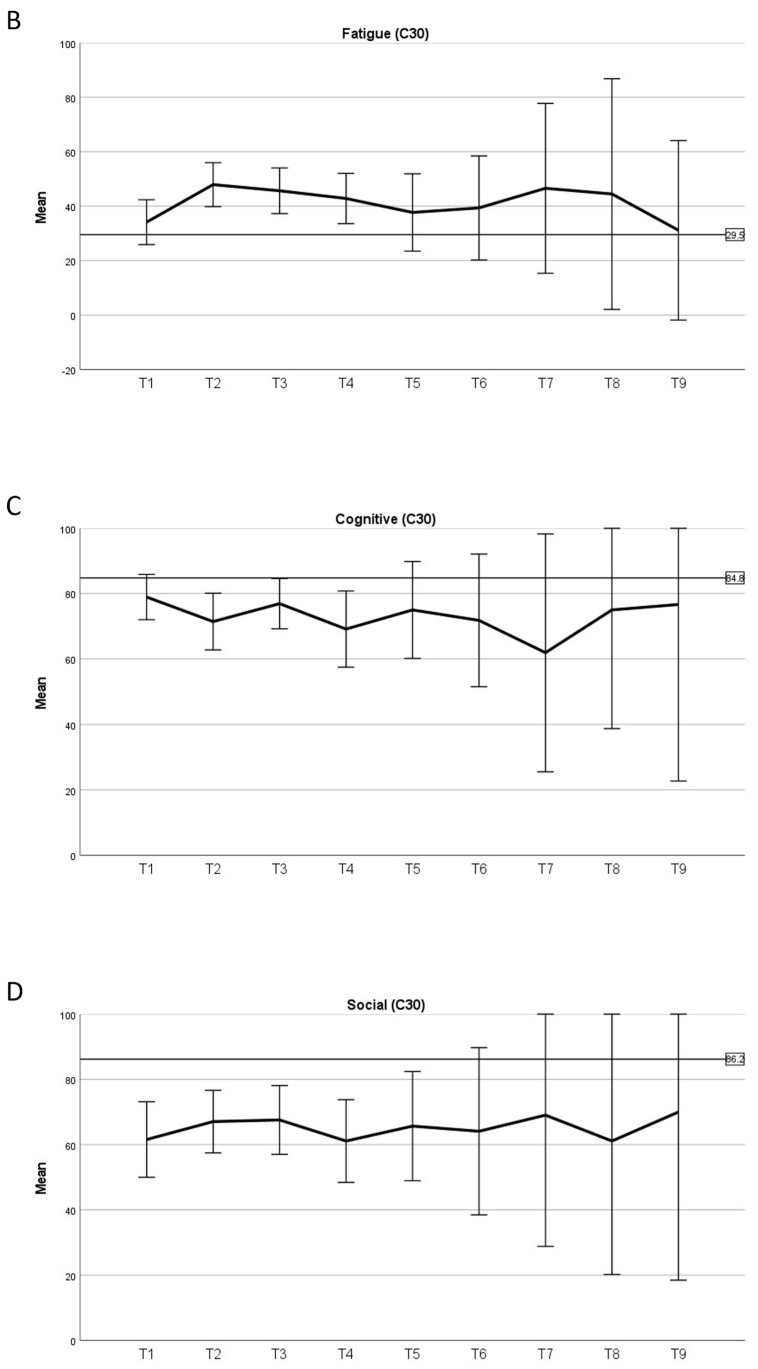
Figure 3.
Quality of life: global health (A), fatigue (B), cognitive function (C) and social function (D) before (T1), during (T2) and the end (T3) of proton therapy and yearly thereafter (T4-9). Error bars denote 95% confidence interval. Black bold line indicates normative reference values for the general population as described by Nolte et al. [25].


