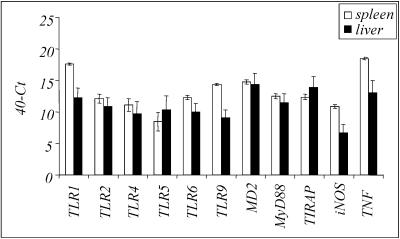
FIG. 2.
Basal mRNA expression in spleens and livers of mock-infected animals: comparison of basal levels of all molecules analyzed by real-time PCR in spleens and livers from mock-infected C57BL/6 mice. Cycle threshold (Ct) values are expressed subtracted from 40 (the negative endpoint); higher values represent higher levels of mRNA.

