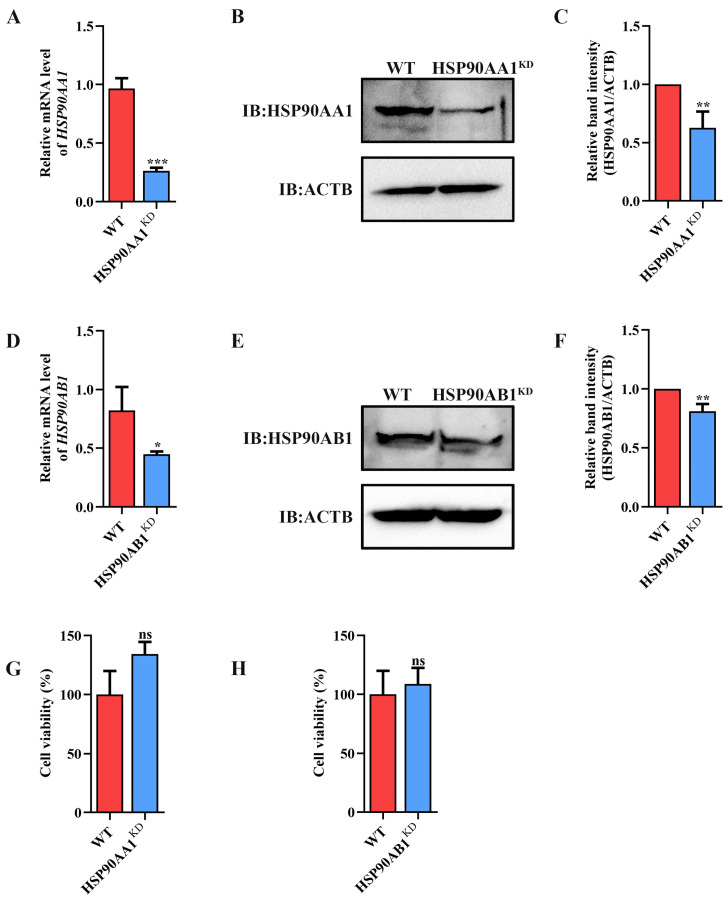
Figure 2.
Identification of HSP90AA1 and HSP90AB1 knockdown cells. (A) qRT-PCR and Western blot of HSP90AA1 gene mRNA and (B) protein levels in WT and HSP90AA1 KD cells. (C) The band density of the protein was quantified using Image J software, and the HSP90AA1 to ACTB ratios were normalized to the control. (D) qRT-PCR and Western blot of HSP90AB1 gene mRNA and (E) protein levels in WT and HSP90AB1 KD cells. (F) The band density of the protein was quantified using Image J software, and the HSP90AB1 to ACTB ratios were normalized to the control. (G,H) Cell viability of WT and (G) HSP90AA1 or (H) HSP90AB1 KD cells were evaluated by CCK-8 assay. * means p ≤ 0.05, ** means p ≤ 0.01, *** means p ≤ 0.001, ns means p > 0.05.

