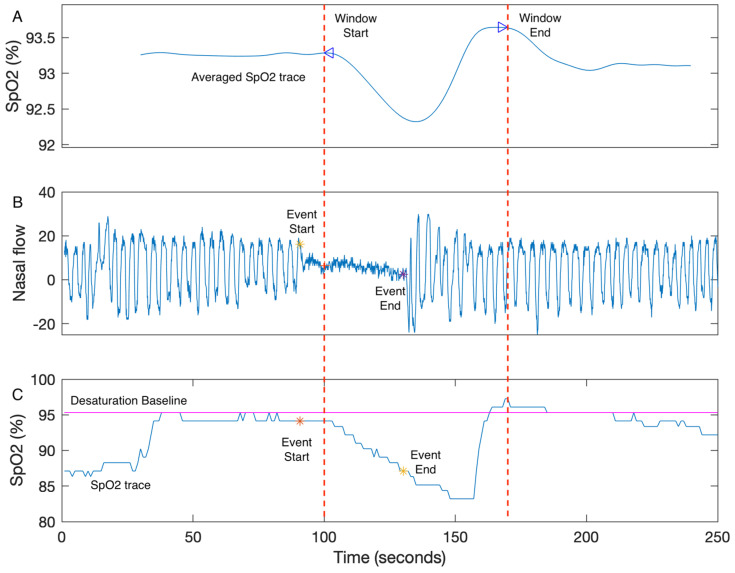
Figure 2.
The example of HB calculation. (A) The search window is defined as the two peaks of the averaged SpO2 trace. (B) The nasal flow (blue) and the end points of a respiratory event (event start: yellow star; event end: purple star) are shown. (C) The SpO2 trace of the corresponding respiratory event is shown. The desaturation area for a single event is the area above the SpO2 trace (blue), below the desaturation baseline (magenta), and within the search window (between window start and window end). The desaturation baseline is the maximum SpO2 value within 100s prior to the event end (yellow star). HB is calculated as the sum of desaturation events divided by the total time of sleep [14].

