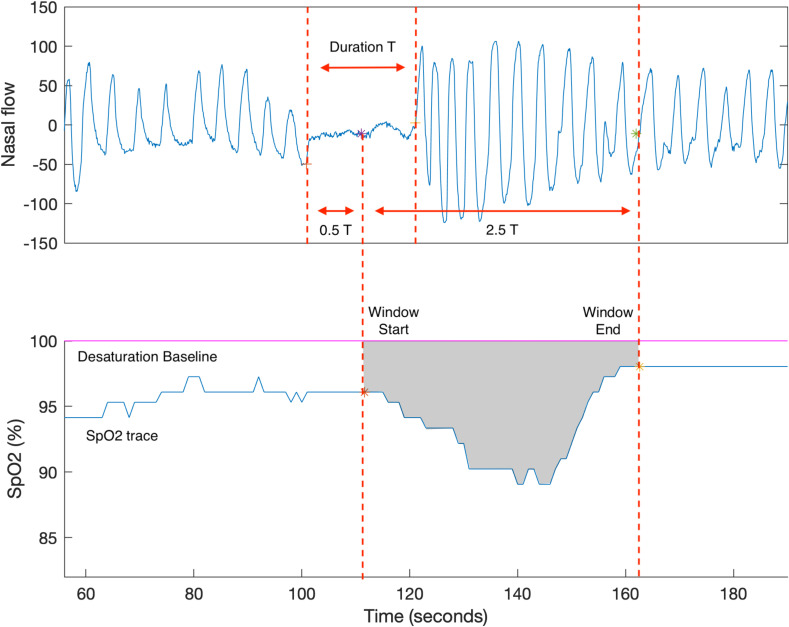
Figure 3.
The example of REDTA calculation. (A) The nasal flow and a respiratory event are shown. The search window starts at the midway of the respiratory event and extends for 2.5 T, where T is the event duration. (B) The SpO2 trace of the corresponding respiratory event is shown. REDTA is calculated as the sum of the area (grey) within the search window, SpO2 trace, and the 100% desaturation baseline divided by 3600 [47].

