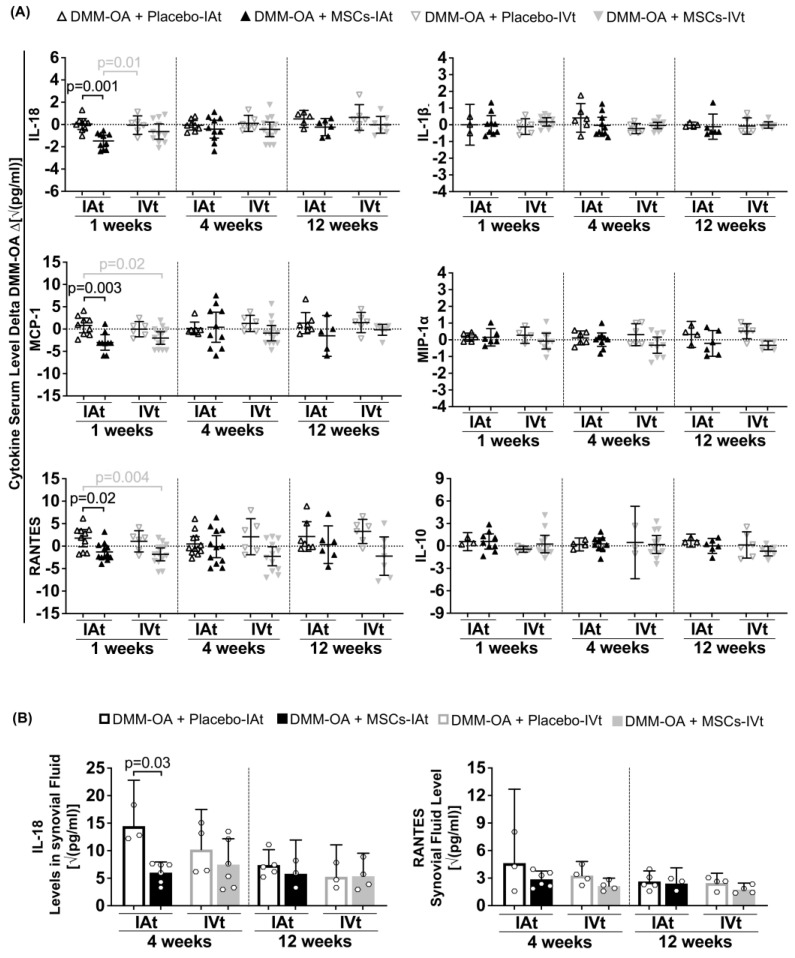
Figure 3.
Long-term immunomodulation at one (1 w), four (4 w), and 12 weeks (12 w) after mesenchymal stromal cells (MSCs) intra-articular (IAt) or intravenous (IVt) transplantation. (A) Serum and (B) synovial fluid levels of cytokines/chemokines measured using a multiplex bead assay. For serum analysis, the horizontal dotted line represents the average serum level of each group average at 9 weeks after DMM–OA surgery (positive control). The data are expressed as the delta between the positive control and intervention groups. Vertical dashed lines separate comparisons at different time points. Black brackets indicate comparisons between IAt vs. IAt or IVt vs. IVt, while grey brackets represent comparisons between IAt vs. IVt. Statistical p-value is shown above the respective bracket.

