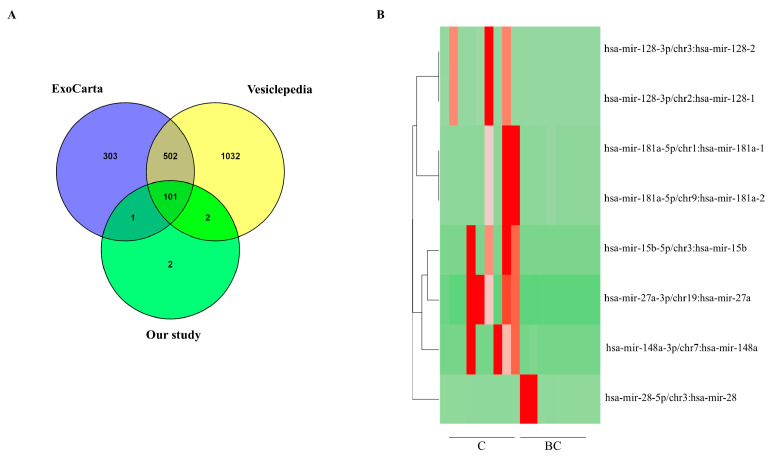
Figure 2.
Differentially expressed EV-miRNAs in healthy subjects and breast cancer patients measured by RNA-seq. (A). Venn diagram of the known miRNAs in our study, vesicular Vesiclepedia and ExoCarta databases. (B). Heatmap of the differentially expressed EV-miRNAs in healthy subjects (C) and breast cancer patients (BC). The red and the green color scale indicate an increase and a decrease in miRNA expression levels, respectively.

