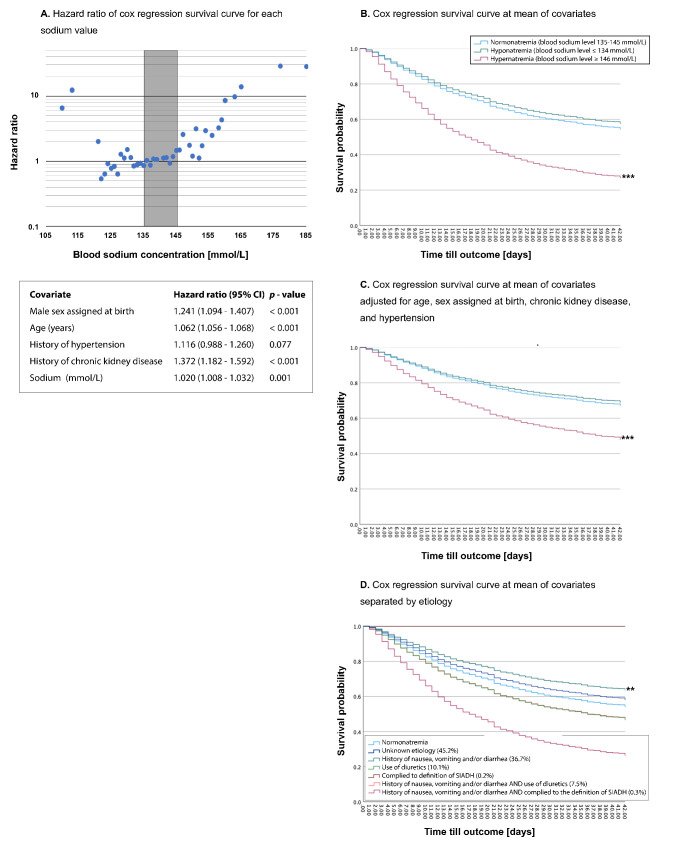
Figure 1.
HRs of Cox proportional survival curves for survival probability for each sodium value adjusted for age, sex assigned at birth, a history of chronic kidney disease and a history of hypertension. The grey area indicates the normonatremia. Table shows HRs for covariates and sodium as a continuous variable (A). Cox proportional survival curves at the mean of covariates for (B) unadjusted 6-week mortality stratified by normonatremia, hyponatraemia and hypernatraemia, (C) 6-week mortality adjusted for age, sex assigned at birth, a history of chronic kidney disease and a history of hypertension stratified in normonatremia, hyponatraemia and hypernatraemia, (D) unadjusted 6-week mortality stratified by aetiology. **Indicates a p value<0.01. ***Indicates a p value<0.001.

