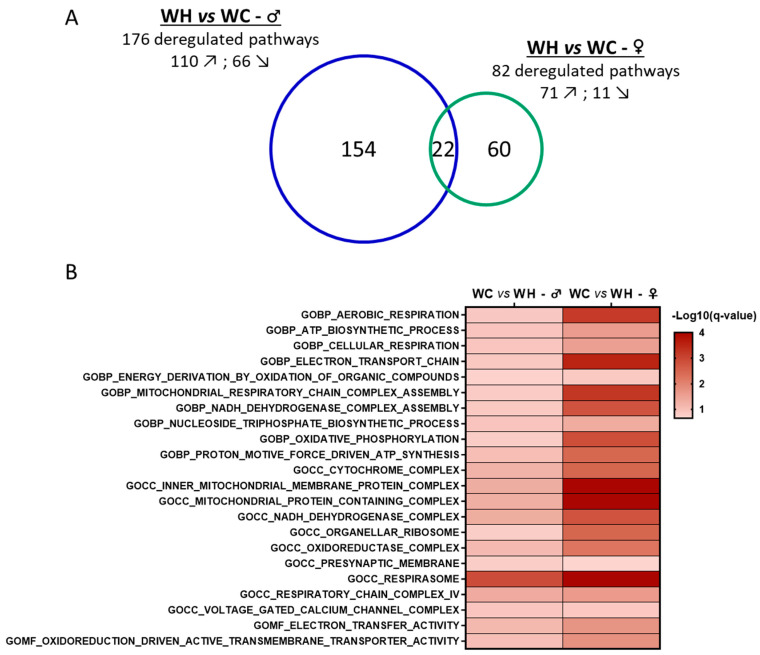
Figure 5.
Sex comparison of gene set enrichment analysis (GSEA) results from the hippocampal transcriptome of 7-month-old male and female offspring. (A) The Venn diagram represents the number of gene ontology (GO) terms significantly enriched (false discovery rate < 0.25) in terms of cellular components, biological pathways and molecular functions in GSEA. (B) Heatmap of the 22 common significantly deregulated gene sets by the maternal high-fat diet between male and female offspring and associated significance. n = 5 WC females; n = 5 WH females; n = 4 WC males; n = 4 WH males. ↗ = pathways increased by the maternal high-fat diet. ↘ = pathways decreased by the maternal high-fat diet.

