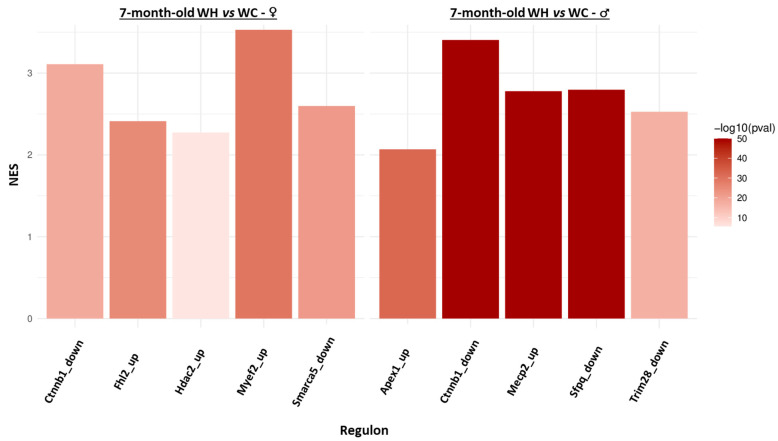
Figure 7.
Identification of regulons deregulated by the maternal high-fat diet from hippocampal transcriptome and proteome data of 7-month-old male and female offspring. The bar plots represent regulons significantly (adjusted p-value < 0.001 and |normalized enrichment score (NES)| > 2) enriched in upregulated/downregulated genes in WH mice (females on the left and males on the right). A positive NES means that the regulon is enriched in upregulated genes. In the regulon name, “up” and “down” correspond to the activating or inhibiting effect of the transcription factor on the regulon genes, respectively.

