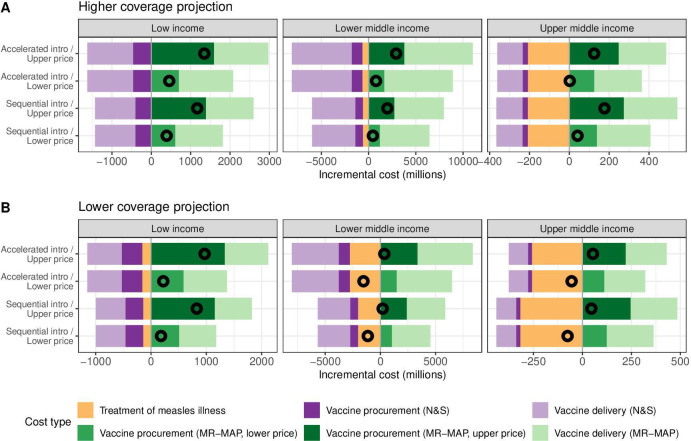
Figure 3.
Breakdown of incremental costs following MR-MAP introduction under the assumptions of higher coverage projection (A) and lower coverage projection (B). For each horizontal bar, incremental costs of measles treatment, vaccine procurement and vaccine delivery are stacked and denoted in different colours. Hollow circles represent overall incremental costs. The vertical line is set at zero; to its left, negative values (purple and yellow bars) indicate savings following the MR-MAPs introduction, while to its right, positive values (green bars) indicate increased costs. DALY, disability-adjusted life-year; MR-MAP, measles-rubella microarray patch; N&S, needle and syringe.

