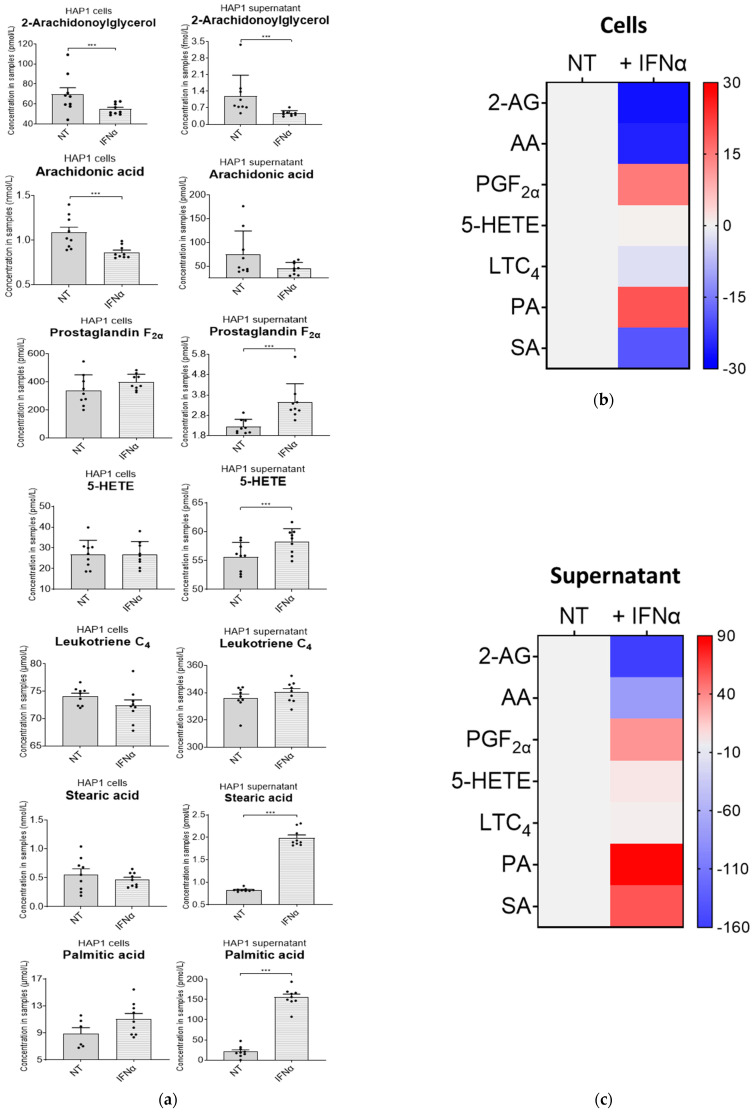
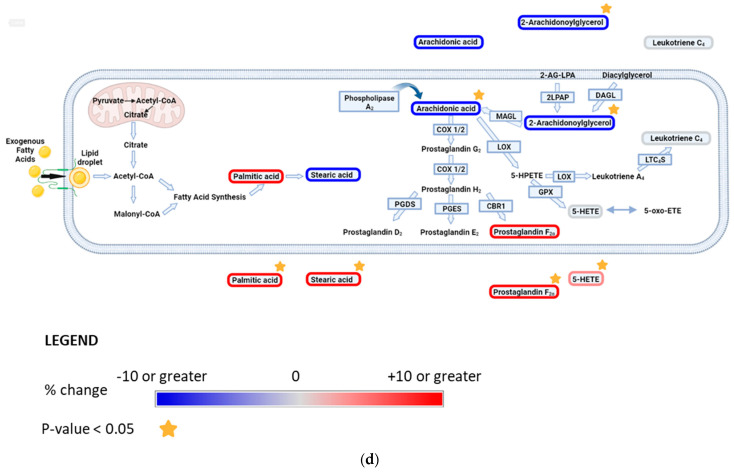
Figure 3.
Interferon alpha modulates eicosanoid and fatty acid pathways. (a) Analysis of bioactive lipids in HAP1 cells and cell supernatants after 36 h treatment with IFN-I. (a) Graphs represent the mean with the standard error of the mean (SEM). Cell results are the graphs on the left; the corresponding cell supernatant is on the right. Grey bars are for the not-treated sample (NT) and grey bars with a white stripe pattern are the results for the IFN-I-treated samples. The statistical analysis is the two sample (or unpaired) t-test. A p-value less than 0.05 (***) suggests that the results have highly significant differences. If there is no significance difference, it is not labelled. (b) Mean percentage change of bioactive lipids in HAP1 cells, not-treated (NT) and treated with IFNα for 36 h (+IFNα). (c) Cell supernatant from HAP1 cells, not-treated (NT) and treated with IFNα for 36 h (+IFNα). Heat maps display normalised lipid abundances relative to the mean concentration of the non-treated samples (NT), which is represented by the grey bars. For IFN treatment, blue results are for a decrease in concentration, in percentage, grey is for no change and red is for an increase in concentration in percentage. (d) Bioactive lipid profile after 36 h treatment with IFN-I. Converting enzymes are in boxes and the lipids in this study are circled. Lipids circled in grey have no change compared to non-treated cells; lipids circled in blue have a decreased concentration compared to non-treated cells; and lipids circled in red have an increased concentration compared to non-treated cells. Lipids discovered in the cell supernatant are outside of the cell lipid membrane. Lipids with a significant difference between non-treated and treated (a p-value of less than 0.05) are indicated by a yellow star.


