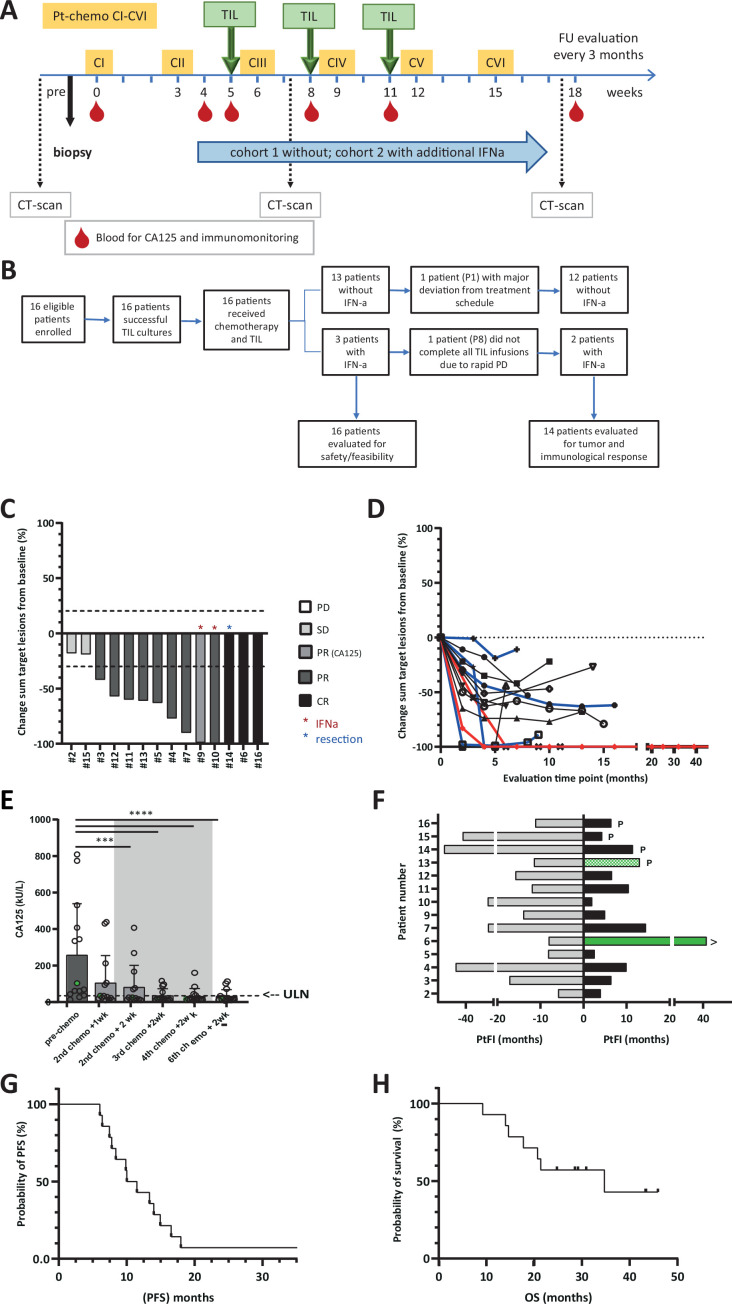
Figure 1.
Study design and patient inclusion and clinical response evaluation. (A) Treatment schedule given in weeks. Platinum-based-chemotherapy is given as six consecutive cycles (CI thru CVI) starting form week 0. Three TIL infusions are given two weeks after the second, third and fourth chemotherapy cycle. (B) Patient disposition; 16 patient were enrolled and received chemotherapy+TIL and three of them also received IFNa. All these patients were evaluated for safety and feasibility. Two patients were not evaluated for tumor and immunological response due to gross deviation from the treatments schedule or rapid PD precluding completion of TIL infusions. (C–H) Clinical response was evaluated according to RECIST V.1.1. in patients (n=14) that completed chemotherapy and TIL infusion cycles. (C) Waterfall plot showing the % change in sum of target lesion size from baseline. The best overall response is indicated in the color of the bars. The red asterisk indicates the two patients that received IFNa in addition to chemotherapy and TIL, the blue asterisk indicates the patient that obtained a CR after resection of the remaining target lesion. Patient #9 did not have an evaluable target lesion, but was evaluated based on reduction of CA125 level. (D) Spider plot showing the change in sum of target lesions from baseline in time. Blue lines show the response in patients that received PARP inhibitor after completion of the chemotherapy plus TIL cycles. In red the patient that obtained a durable CR after chemotherapy and TIL is depicted. (E) Change of tumor-marker CA125 measured in blood samples before, during and after therapy. Bars represent the mean CA125 levels (kU/L) and dots the values for individual patients. The gray area indicates the period when the 3 consecutive TIL infusions were administered. The dotted line indicates the upper level of normal (ULN). Significant change from baseline: ***p<0.001, ****p<0.0001 by Friedman with Dunn’s correction for multiple comparisons. (F) Platinum free interval (PtFI) prior to treatment (gray bars, to the left) and post-treatment (black and green bars, to the right), measured as time to progression according to RECIST V.1.1 from the time point of the last chemotherapy cycle (in months). The green bars indicate patients with a longer PtFI post-treatment than pretreatment. Patients that received PARPi after chemotherapy plus TIL are indicated by the p and ongoing response by the >behind the appropriate bars. (G) PFS as evaluated according to RECIST V.1.1 and (H) OS curves according to Kaplan-Meier. CR, complete response; OS, overall surviva; PD, progressive disease; PFS, progression-free survival; PR, partial response; RECIST, Response Evaluation Criteria In Solid Tumors; SD, stable disease.

