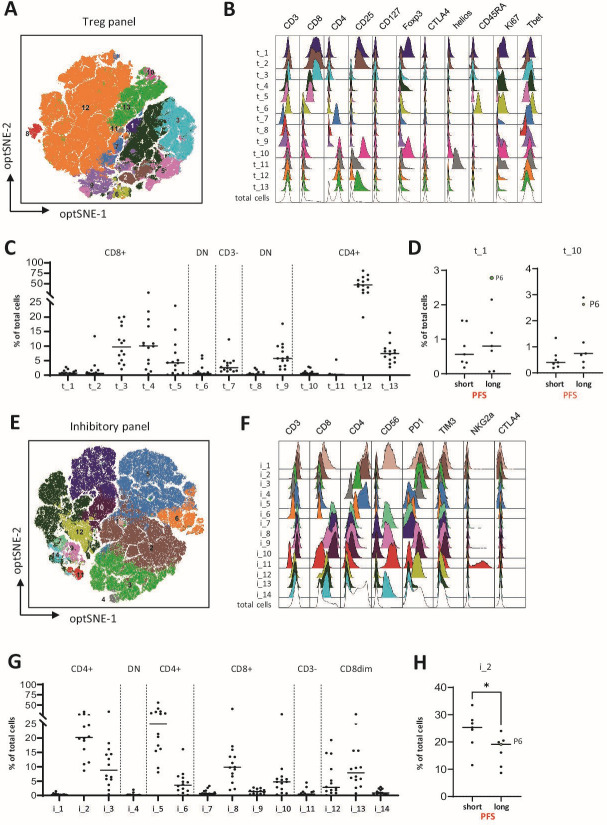
Figure 2.
Immunophenotyping of infused TIL. Administered TILs were stained with antibody panels specific for regulatory T cells (t) and inhibitory/activation (i) T cell markers, as indicated in online supplemental table 2. High-dimensional single cell data analysis of the stained TIL were performed by opt-Distributed Stochastic Neighbor Embedding (optSNE) and FLOWSOM using OMIQ software (A) Overlay of 13 different FLOWSOM clusters (t_1 thru t_13) for all TIL batches stained with the Treg marker Ab-panel plotted on the optSNE map. (B) Expression levels of each of the indicated regulatory T cell markers are depicted for the individual populations t_1 thru t_13 and for the total TIL population. (C) Frequencies of the identified populations in the total TIL populations are shown and grouped on major phenotypic characteristics, shown above the data. (D) Frequencies of CD8+ (t_1) and CD4+ (t_10) T cell populations with a regulatory T cell phenotype are shown as percentage of total TIL for patients with a shorter (short) or longer (long) than median PFS, respectively. (E) Overlay of 14 different FLOWSOM clusters (i_1 thru i_14) for all TIL batches stained with the inhibitory/activation marker Ab-panel plotted on the optSNE map. (F) Expression levels of the indicated inhibitory/activation T cell markers is depicted for these individual populations i_1 thru i_14 and for the total TIL population. (G) Frequencies of the identified populations in the total TIL populations are shown and grouped on major phenotypic characteristics, shown above the data. (H) Frequencies of the CD4+PD-1+Tim-3+ (i_2) T cell population is shown as percentage of total TIL for patients with a shorter (short) or longer (long) than median PFS, respectively. *p<0.05 by Mann-Whitney U test, and P6 indicates the patient with the durable CR after treatment. CR, complete response; PFS, progression-free survival; TIL, tumor-infiltrating lymphocytes.

