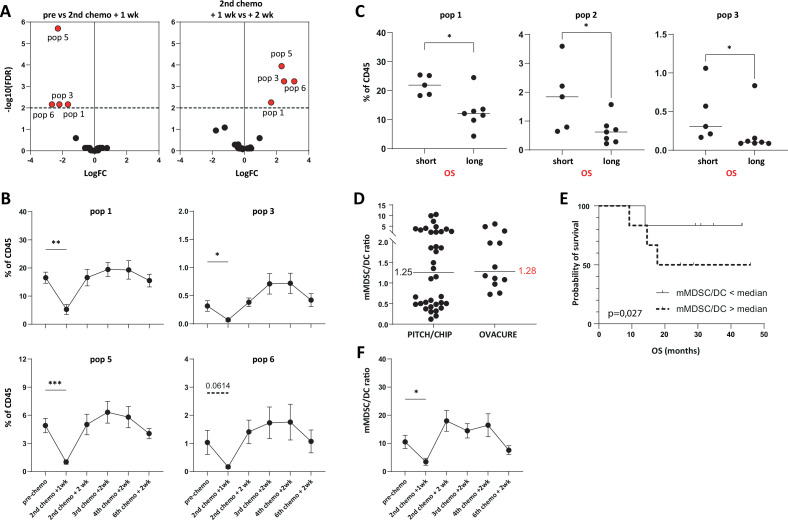
Figure 5.
Treatment affects circulating myeloid cell numbers and the mMDSC/DC ratio. (A) Treatment-induced changes in specific cell populations, defined and described in figure 4, were further analyzed. Populations 1, 3, 5, and 6 showed the largest and most significant change when frequencies between pretreatment versus second chemotherapy+1 week samples (left panel), and also when samples from 1 vs 2 weeks after the second chemotherapy (right panel), were compared using OMIQ and edgeR. (B) Frequencies of sequential blood samples show a transient and significant decrease in populations 1, 3, 5, and a near significant decrease in population 6 from baseline, (C) Baseline frequencies of population 1, 2 and 3 were depicted for patients with a shorter and longer than median OS, respectively. Given p values according to Mann-Whitney U test. (D) Baseline mMDCS/DC ratios were calculated and compared with ratios previously determined and described for ovarian cancer patients included in the PITCH or CHIP trial.10 In brief, CD3−CD19−CD56-HLA-DR−/lowCD14+CD15− (mMDSC) and CD3−CD19−CD56−HLA-DR+CD14−CD11c+ (DC) were determined as percentage of total CD45+ cells after multicolor flowcytometry (as described in figure 4) and ratios of these cell populations are plotted for evaluated patients in the PITCH-CHIP trial (n=36) and OVACURE trial (n=12). (E) Kaplan-Meier plots show the survival of patients divided in patients with an mMDSC/DC ratio above (dotted line) and below (solid line) median. (F) mMDSC and DC frequencies were determined in sequential blood samples obtained at baseline and during treatment and show a significant but transient, treatment-induced reduction in mMDSC/DC ratio at 1 week after the second chemotherapy cycle.*p<0.05, **p<0.01, ***p<0.001 by Kruskal-Wallis with Dunn’s correction for multiple comparisons. DC, dendritic cell; MDSC, myeloid-derived suppressor cells; OS, overall survival.

