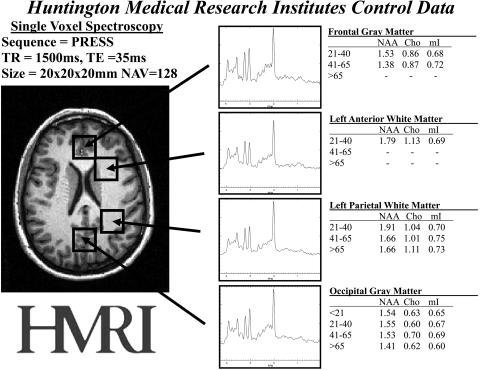
FIG. 2.
Normative proton MRS data from multiple regions of the brain. These four regions alone provide diagnostic value and precision for many diseases. The regions of interest are shown on the MRI on the left and representative spectra are shown in the middle. Normative metabolite ratio values are shown on the right. Standard deviations of 5–7% are omitted.

