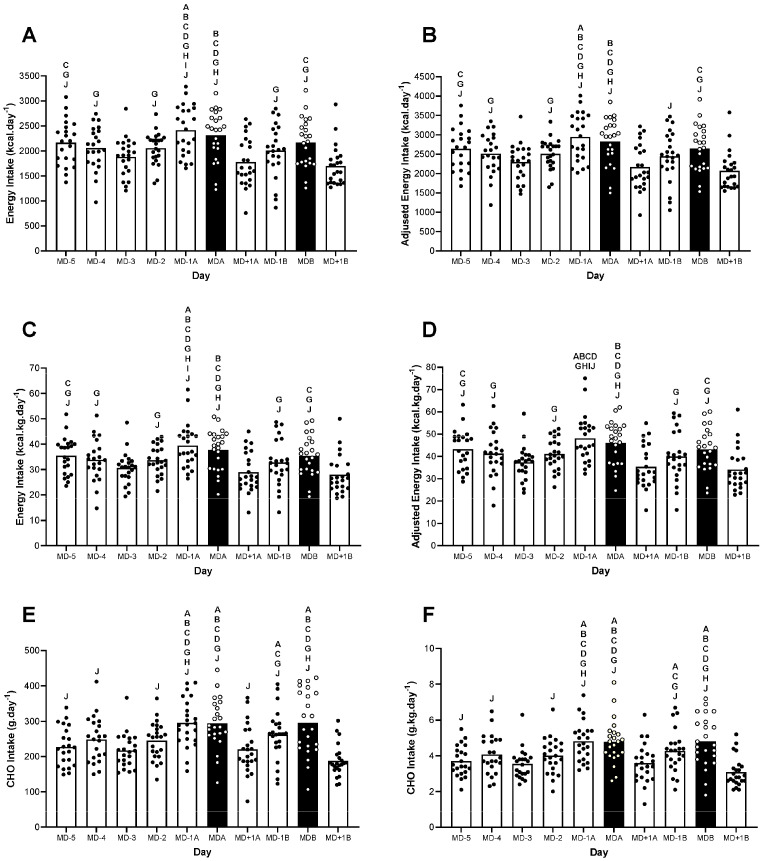
Figure 2.
An overview of the energy and CHO intake throughout the 10-day period. (A) Absolute energy intake, (B) adjusted absolute energy intake, (C) relative energy intake, (D) adjusted relative energy intake, (E) absolute carbohydrate intake and (F) relative carbohydrate intake. Black bars represent match days. A is significantly higher than MD-5, B is significantly higher than MD-4, C is significantly higher than MD-3, D is significantly higher than MD-2, E is significantly higher than MD-1, F is significantly higher than MDa, G is significantly higher than MD+1a, H is significantly higher than MD-1b, I is significantly higher than MDb and J is significantly higher than MD+1b, all p < 0.05.

