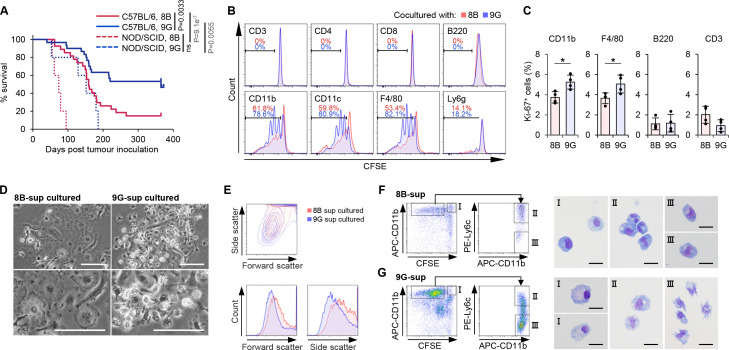
Figure 1.
8B and 9G glioblastoma cells differently affected macrophages (Mφs). (A) One thousand 8B or 9G cells were transplanted into C57BL/6 mouse brain (8B (red solid line) n=30, 9G (blue solid line) n=27) or NOD/SCID mouse brain (8B (red dotted line) n=5, 9G (blue dotted line) n=5); then, mouse survival was observed. Statistical analyses were performed using the log-rank test with Bonferroni correction. The p values<0.05/6=0.0083 (Bonferroni correction) were considered as statistically significant. NS, not significant. (B) Proliferation of immune cells in co-culture with 8B or 9G cells. Whole splenocytes from C57BL/6 mice were stained with carboxyfluorescein diacetate succinimidyl ester (CFSE) and then co-cultured with 8B or 9G for 5 days. The resulting cells were stained with the individual immune cell marker indicated in the plots; CFSE reduction in each immune cell was flow cytometrically measured. The proliferation immune cell in 8B-co-cultured cells is shown in red histograms; 9G-co-cultured cells are shown in blue histograms. The percentage of proliferated immune cell in 8B-co-cultured cells is shown in red numbers; corresponding result of 9G-co-cultured cells are shown in blue numbers. (C) 8B and 9G cells were co-cultured with whole splenic cells for 4 days. The percentage of Ki67-positive cells among CD11b, F4/80, B220, and CD3 positive cells was determined by flow cytometry analysis. The bars indicate the mean (±SD). Each dot represents the Ki-67 positive percentage in each sample. *p<0.05, Student’s t-test. (D) Phase contrast images of generated Mφs by co-culture of splenic F4/80+ cells and 8B or 9G supernatant. Bars; 50 µm. (E) Whole splenocytes were cultured in 8B supernatant or 9G supernatant for 11 days. Generated cells were analyzed by flow cytometry. Forward scatter and side scatter of generated CD11b+ cells are shown. Red lines show 8B-cultured cells; blue lines show 9G-cultured cells. (F and G) Morphological analysis of generated Mφs that proliferated in response to 8B (F) or 9G (G) supernatants. CFSE-labeled splenocytes were co-cultured with 8B or 9G for 4 days. Quiescent or proliferated CD11b+ cells were sorted based on CFSE fluorescence reduction. Proliferated CD11b+ cells were further subdivided into Ly6c-positive or Ly6c-negative fractions. Each fractionalized cell type was stained using a Diff-quick stain. Bars; 10 µm.

