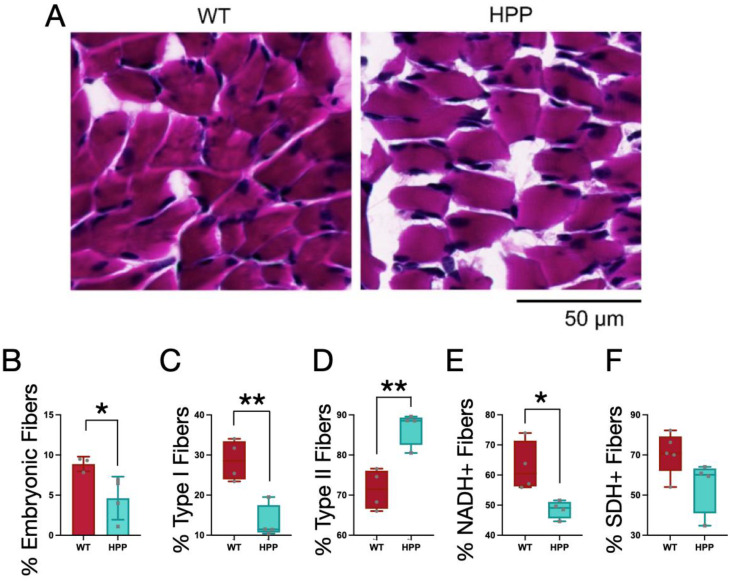
Figure 4.
Effect of hypophosphatasia (HPP) on muscle fiber morphology and type. (A) Hematoxylin and eosin staining of gastrocnemius muscles from wildtype (WT) (n = 5) and HPP (n = 4) mice reveal normal muscle fiber structure. (B) HPP mice (cyan) had a significantly decreased proportion of embryonic MyHC-expressing muscle fibers compared to WT (red) (*, p ≤ 0.05; n = 3–4/group), with both (C) significantly fewer type I (or slow) muscle fibers (**, p ≤ 0.01; n = 4/group) and (D) significantly more type II (or fast) muscle fibers (**, p ≤ 0.01; n = 4/group). (E) As a percentage of the total muscle fibers, there were significantly fewer NADH-positive fibers in the HPP mice (*, p ≤ 0.05; n = 4/group), (F) but there was no significant difference in the percent of SDH-positive fibers between the groups (p = 0.087, n = 4/group). Independent t-tests assessed mean differences between WT and HPP genotypes.

