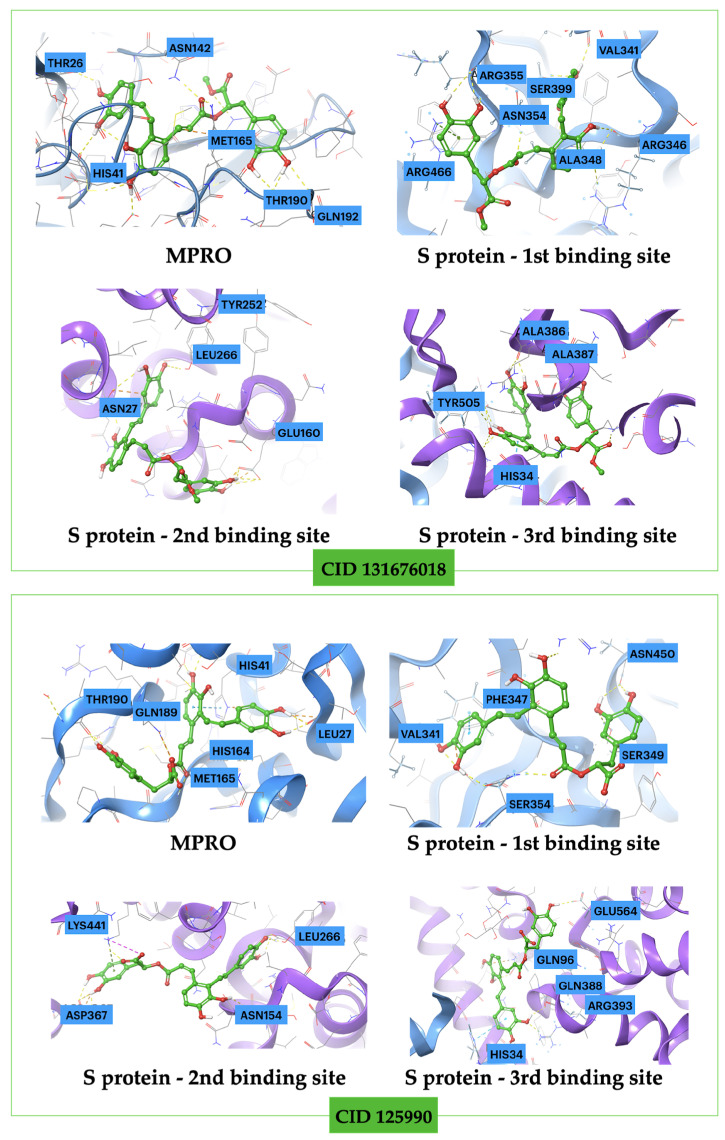
Figure 13.
Visualization of the three-dimensional intermolecular interactions within protein–131676018 and protein–125990 complexes, conducted for each binding site following the completion of IFD studies. The carbon atoms of the two ligands are represented in green, and the oxygen atoms in red. Hydrogen bonds are represented by yellow dashed lines, while pi–cation interactions are depicted in green.

