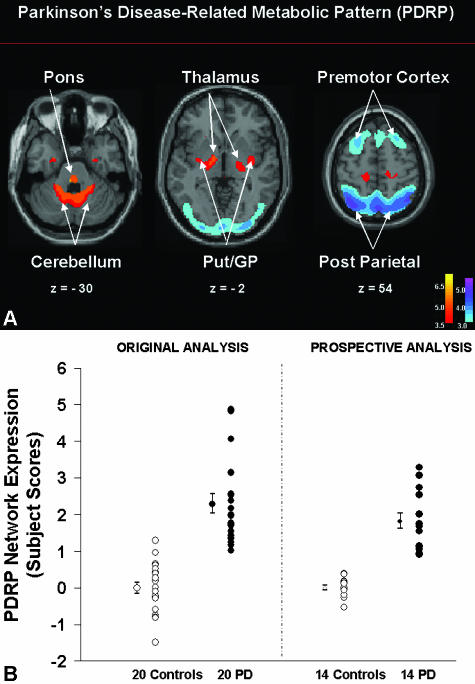
FIG. 1.
A: Parkinson's disease-related metabolic pattern. This pattern of regional metabolic covariation was identified by network analysis of [18F]-fluorodeoxyglucose (FDG) PET scans from 20 PD patients and 20 age-matched normal volunteer subjects.14, 123 This PDRP (representing the first principal component, which accounted for 20.7% of the subject × voxel variation) was characterized by pallidal, thalamic, pontine, and cerebellar hypermetabolism associated with metabolic decrements in the lateral premotor and posterior parietal areas. The display represents voxels that contribute significantly to the network at p = 0.001, and that were demonstrated to be reliable by bootstrap estimation (p < 0.0001). [Voxels with positive region weights (metabolic increases) are color coded from red to yellow; those with negative region weights (metabolic decreases) are color coded from blue to purple. The numbers under each slice are in millimeters, relative to the anterior-posterior commissure line.] B: Prospectively computed PDRP scores accurately discriminate subjects by blinded network analysis. Left: PDRP expression (subject scores) in the 20 PD patients (filled circles) and 20 control subjects (open circles) described above. Network activity was significantly increased in the PD cohort (p < 0.00001). Right: In a prospective individual case analysis (see text), we computed the expression of the PDRP (see panel A) in 14 subsequent PD patients (filled circles) and 14 control subjects (open circles). These computations were conducted using an automated routine that was blind to diagnostic category.38, 41 As in the original analysis, prospectively computed PDRP scores were significantly elevated in the disease group (p < 0.00001).

