Figure 1.
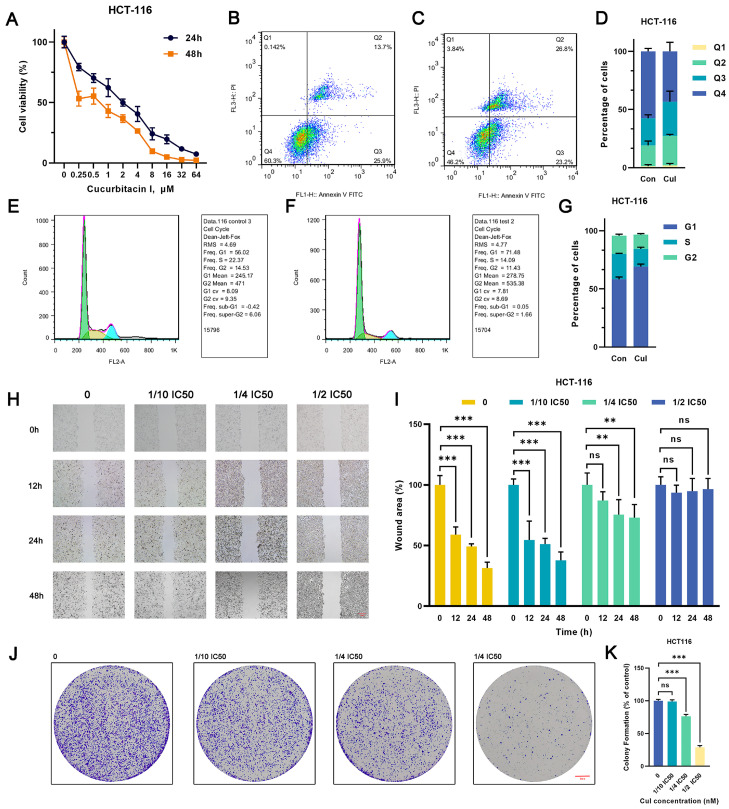
Cucurbitacin I has an inhibitory effect on the CRC cell phenotype. (A) HCT116 cells were treated with cucurbitacin I (0, 0.25, 0.5, 1, 2, 4, 8, 16, 32, 64 μM) for 24 and 48 h, and cell viability (%) was measured. (B–D) Representative flow cytometry plots and quantitative results (D) depicting the apoptotic characteristics of HCT116 cells treated with cucurbitacin I (500 nM) (C) compared with non-treated ones (B). (E–G) Flow cytometry indicated that cucurbitacin I resulted in changes in cell proportions at the G1/S phase in HCT116 cells cultured in the absence (E) and presence (F) of cucurbitacin I (500 nM). In the flow cytometry plot, the green peak represents cells in the G1 phase, the yellow peak represents cells in the S phase, and the blue peak represents cells in the G2 phase. (H,I) Scratch assay of HCT116 cells treated with cucurbitacin I at different concentrations (0 nM, 1/10, 1/4, 1/2 IC50), and the resulting wound area (%) was calculated in (I). Scale bar represents 100 μm. (J,K) Colony formation assay of HCT116 cells treated with cucurbitacin I at different concentrations (0 nM, 1/10, 1/4, 1/2 IC50), and the colony numbers are shown in (K). Scale bar represents 5 mm. The values presented are expressed as mean ± standard deviation (SD) and are based on data obtained from three biologically independent samples. No significance: ns, p < 0.01: **, p < 0.001: ***.

