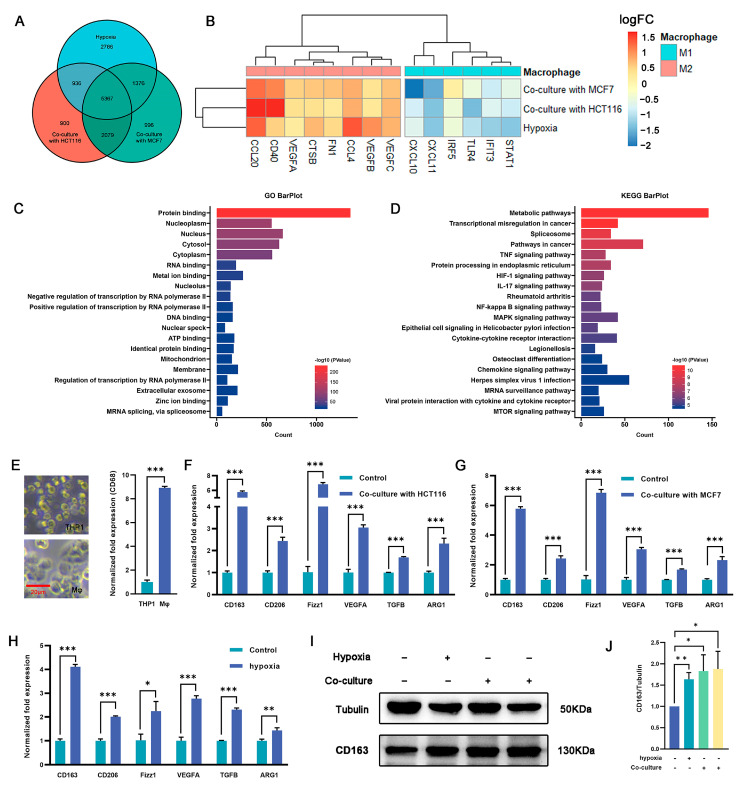
Figure 2.
Regulation of macrophage polarization and expression of M2-type markers by culturing macrophages under hypoxia or in a coculture system. (A) Venn diagram showing the overlap of DEGs among the three macrophage treatment groups (hypoxia, cocultured with HCT116, or cocultured with MCF7 cells) (n = 3 samples) in comparison with THP-1 derived macrophages. (B) Expression (log2FC) of selected M1- and M2-related genes in the three treated macrophage groups, (A) represented as a heatmap. Colors indicate group identity: blue, M1-related genes; red, M2-related genes; adjusted p ≤ 0.05. (C,D) GO and KEGG analyses showing the top 20 functional annotations of the upregulated overlapping DEGs from (A), adjusted p ≤ 0.05. (E) THP1 was induced by PMA for 48 h and exhibited typical M0 macrophage morphology, as represented by bright-field images and upregulated expression of CD163 as measured via qRT-PCR. Scale bar represents 20 μm. (F,G) M2-related genes (Cd163, Cd206, Fizz1, Vegfa, Tgfβ, and Arg1) were significantly upregulated in macrophages cocultured with HCT116 cells (F) and MCF7 cells (G). (H) qRT-PCR analysis revealed upregulation of M2-related gene expression in the hypoxia group vs. controls (namely, normoxia). (I,J) CD163 protein expression in macrophage cells was detected under hypoxia (the second protein lane) or in a coculture system with MCF7 (the third protein lane) or HCT116 (the fourth protein lane) cells versus the control group (the first protein lane) without dual treatment, as determined by Western blot analysis. Tubulin was used for normalization. The values presented are expressed as mean ± standard deviation (SD) and are based on data obtained from three biologically independent samples. p < 0.05: *, p < 0.01: **, p < 0.001: ***.

