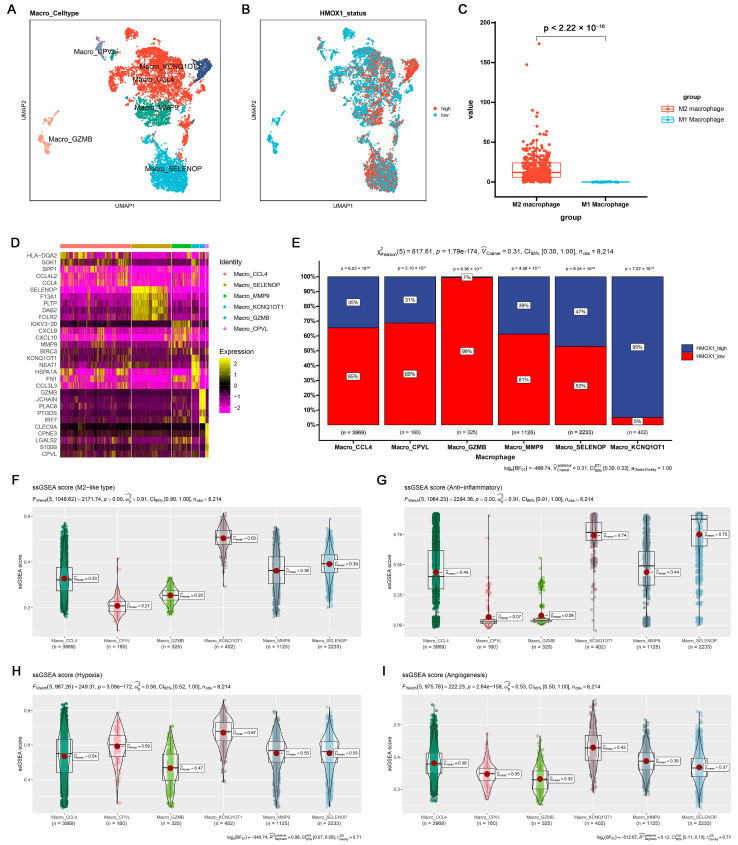
Figure 5.
Single-cell analysis of the Hmox1 expression profile revealed a relationship between Hmox1 and cancer-related processes in BRCA. (A) The UMAP visualization of macrophages from patients with breast cancer, showing the formation of 6 main clusters shown in different colors. The functional description of each cluster was determined by the gene expression characteristics of each cluster. (B) The UMAP visualization of macrophages, with each cell colored based on the relative normalized expression levels of Hmox1. (C) Expression levels of Hmox1 in M2 macrophages in comparison with M1 macrophages from BRCA tumor samples; boxes show the median and whiskers indicate the 95th and 5th percentiles. (D) Heatmap of marker gene expression (y-axis) across BRCA macrophages clusters identified (x-axis). (E) Histogram displaying the cell percentage in the high and low Hmox1 expression groups in five macrophage subclusters. (F–I) Boxplot displaying ssGSEA scores in seven macrophage subclusters from scRNA-seq of BRCA. The ssGSEA score associated with the M2-like type (F), anti-inflammatory properties (G), hypoxia (H), and angiogenesis (I); boxes show the median and whiskers indicate the 95th and 5th percentiles.

