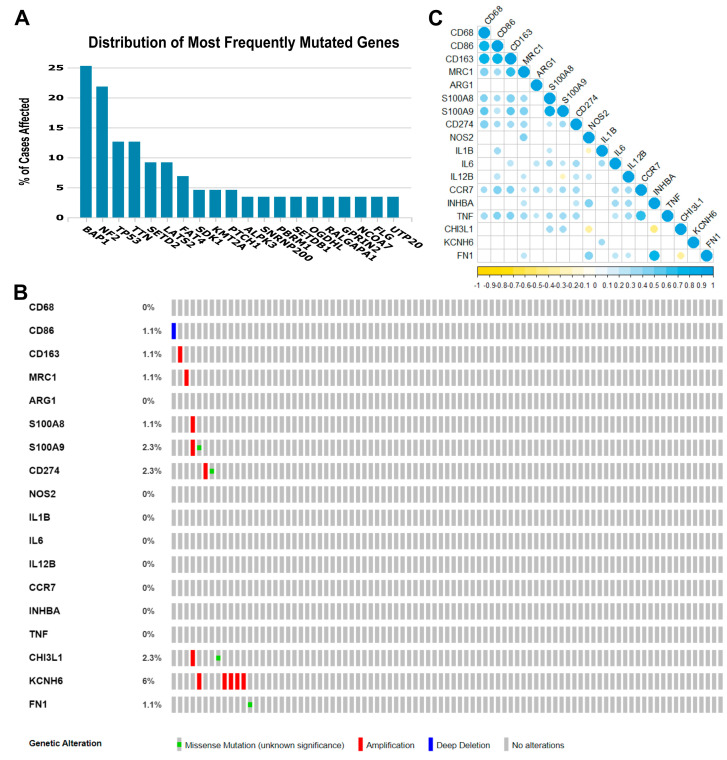
Figure 1.
Genomic landscape of malignant pleural mesothelioma and correlations among the 18 immune genes whose expression was obtained from the TCGA Mesothelioma Pan-Cancer Atlas database. (A) Distribution of the most frequent mutated genes in The Cancer Genome Atlas (TCGA) database (mesothelioma: Pan-Cancer Atlas). The percentage of cases affected in descending order of frequency for BAP1, NF2, TP53, TTN, SETD2, and LATS2 relative to immune-activated gene- or pathway-level somatic mutations. (B) Heat map showing immune gene- or pathway-level somatic mutations (missense mutation, amplification, or deep deletion) and their frequency. The images were downloaded from TCGA and the cBioPortal of Cancer Genomic. (C) The color gradation represents Spearman’s correlation (blue for positive correlations and yellow for negative). The point size represents the rho value; larger points present rho values closer to |1| and, therefore, stronger correlations.

