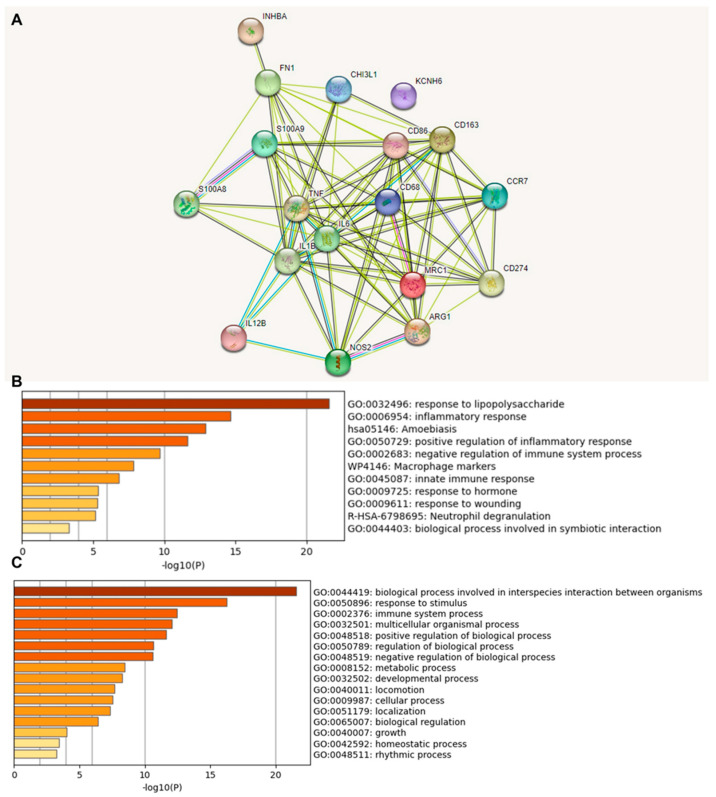
Figure 2.
Protein–protein interaction (PPI) network construction and enrichment analysis of 18 TAM genes. (A) Cluster analysis of the PPI network using the STRING database for protein interactions. The network included the 18 functional genes with the highest interaction confidence score, namely, CD68, CD86, CD163, MRC1, ARG1, S100A8, S100A9, CD274, NOS2, IL1B, IL6, IL12B, CCR7, INHBA, TNF, CHI3L1, KCNH6, and FN1 (p < 1.0 × 10⁻¹⁶). (B) Bar graph of enriched terms across 18 input genes, colored by p-values. (C) The top-level Gene Ontology biological processes involving the 18 input genes. The images were downloaded from STRING and Metascape after input of 18 immune genes.

