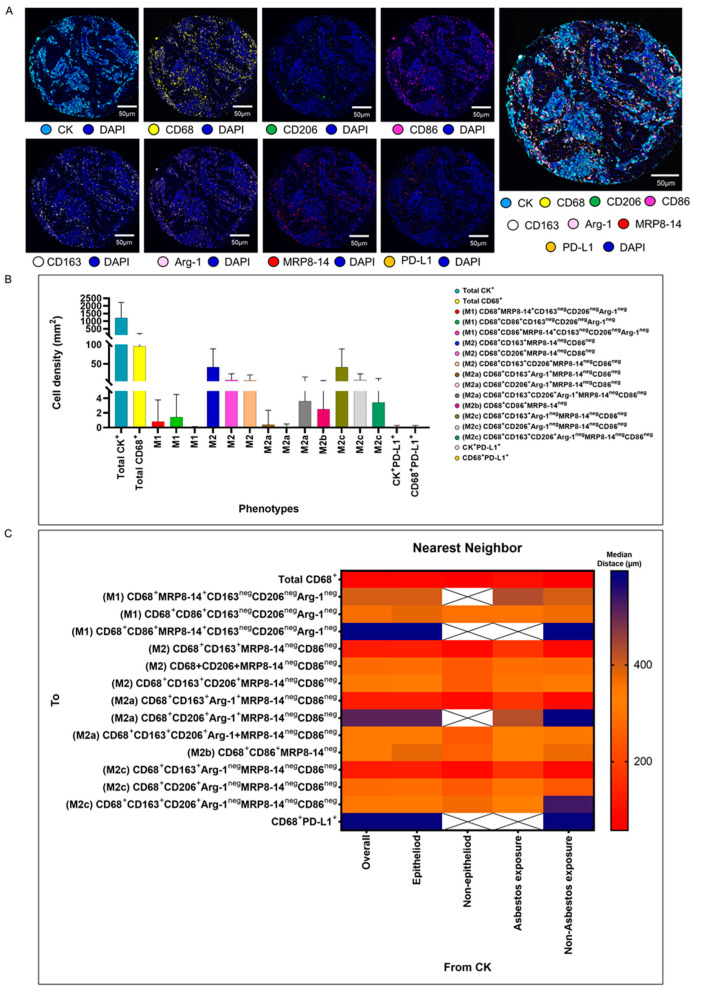
Figure 3.
Representative examples of unmixed and mixed multispectral images, bar graphs of macrophage phenotype densities, and heat maps representing nearest neighbor distance analysis. (A) Unmixed individual markers, including cytokeratin (CK), CD68, CD163, CD206, Arg1, MRP8-14, CD86, PD-L1, and 4′,6-diamidino-2-phenylindole (DAPI), plus their composite spectral mixing image from multiplex immunofluorescence (mIF; 20× magnification; scale bars represent 50 µm on each image). (B) Bar graph of individual densities presented as median values from the macrophage phenotypes observed in the mIF panels. (C) Median distance heat map representing 15 macrophage populations near malignant cells (CK+), including by histologic type and asbestos exposure. White “X” spaces represent data that are not computable or less than one cell by mm2. Data from 68 samples were used. Experiments and quantifications related to the presented results were conducted once. The images were generated using the PhenoImager HT 1.0.13 scanner system and inForm 2.4.0 image analysis software (Akoya Biosciences). The bar graph and the heat map were generated using GraphPad Prism 9.0.0.

