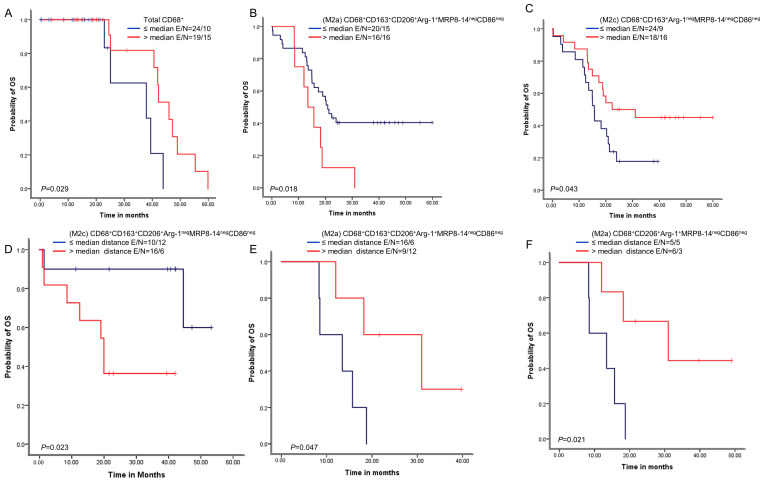
Figure 5.
Kaplan–Meier analysis of overall survival (OS) by cellular densities and nearest neighbor distance analysis from malignant cells for various macrophage subpopulations. Red lines indicate high densities (>median) or close (≤median) distances between malignant cells and various macrophages phenotypes, and blue lines indicate low (≤median) densities or long (>median) distances between malignant cells and various macrophages phenotypes. Patients with high total CD68+ macrophage density (A) and high M2c CD68+CD163+Arg-1negMRP8-14negCD86neg density (B) had better OS than those with lower densities of these macrophage populations. In contrast, patients with high M2a CD68+CD163+CD206+Arg-1+MRP8-14negCD86neg density (C) had worse OS. Patients with close (≤median) distances from malignant cells to M2c CD68+CD163+CD206+Arg-1negMRP8-14negCD86neg macrophages had better OS (D), and patients with close (≤median) distances from malignant cells to (M2a) CD68+CD163+CD206+Arg-1+MRP8-14negCD86neg (E) and M2a CD68+CD206+Arg-1+MRP8-14negCD86neg (F) had worse OS than patients with long distances for these phenotypes. Experiments and quantifications related to the presented results were conducted once. Data from 68 samples were used. Kaplan–Meier curves and log-rank test were used and generated by the R studio software version 3.6.0. with unadjusted p-values. E, events; N, censored number.

