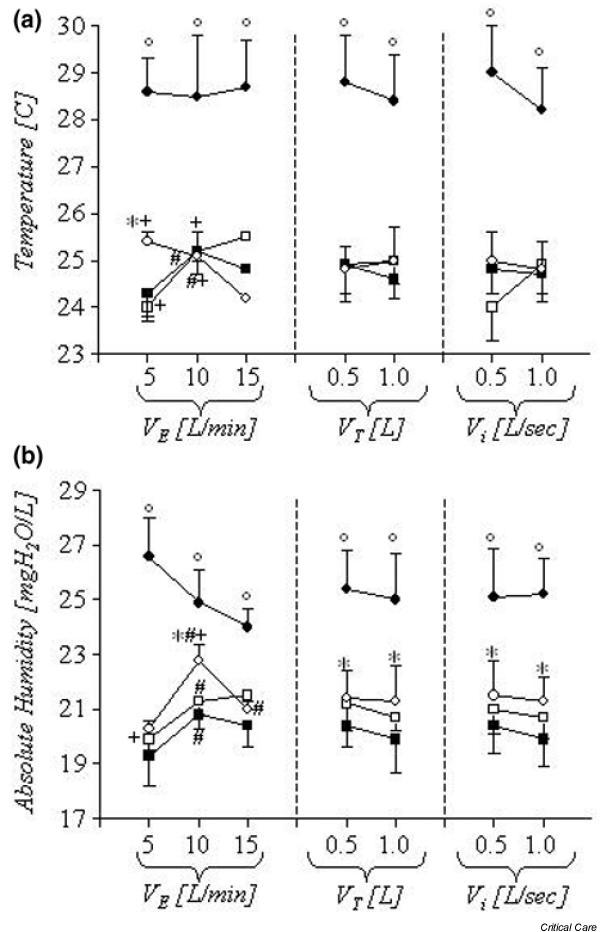
Figure 4.

In vitro study conducted in hypothermic conditions. (a) Temperatures of the active Performer and (b) absolute humidity for the Performer (black circle), passive Perfomer (empty circle), Hygrobac (empty square) and Hygroster (black square). Data are presented as means ± standard deviation. Between the devices: °P < 0.05 versus passive Perfomer, Hygrobac and Hygroster. Within the same device: #P < 0.05 versus VE 5 l/min; +P < 0.05 versus VE 15 l/min. VE = minute ventilation; Vi = peak inspiratory flow; VT = tidal volume.
