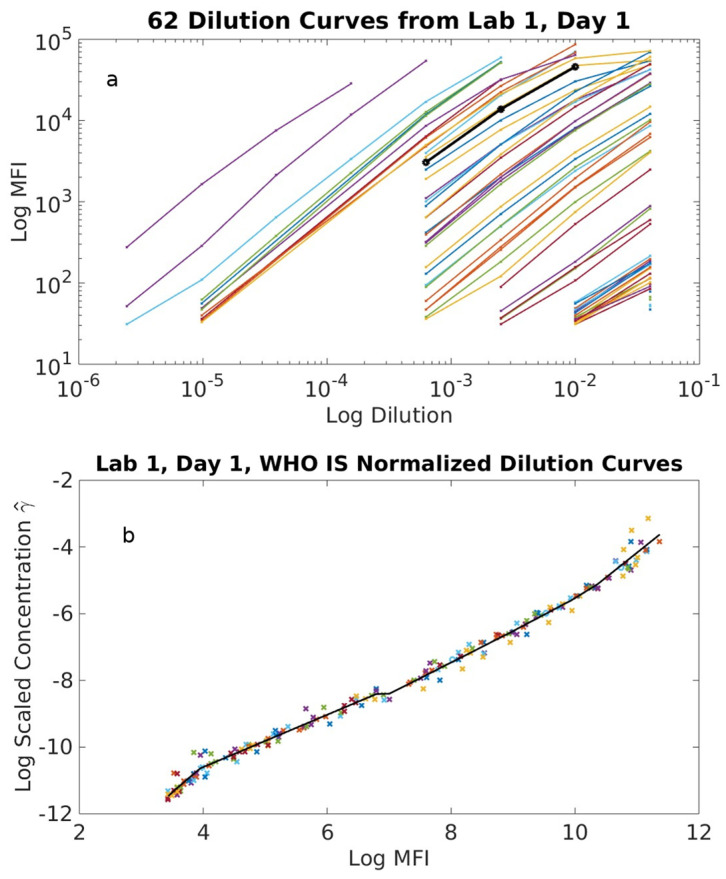
Figure 1.
(a) Sixty-two sample dilution curves from experiment Day 1 obtained by ‘Lab 1’. (b) Shifting of 62 dilution curves from (a) with respect to the antibody level to the WHO IS yields a single normalized master curve of MFI as a function of the normalized antibody concentration. Note that the axes in (b) were switched to allow the mathematical calculation of the optimization functions.

