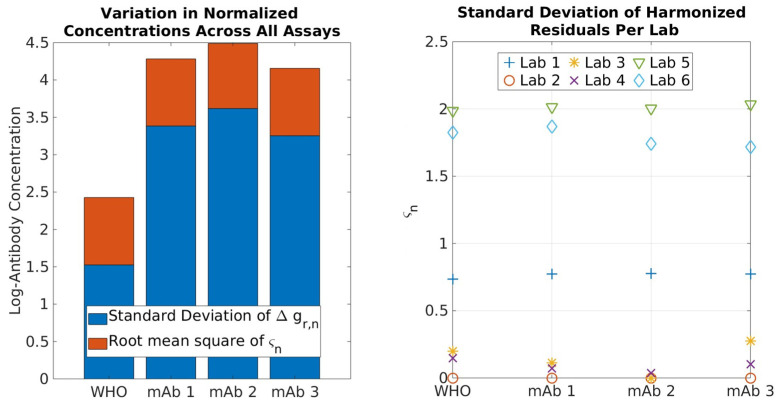
Figure 6.
Left: Contribution of bias from and across all assays using each reference material. Note that, although and carry a sign in Equation (7), these show their contributions in absolute values. Right: Average residuals of the bias-corrected antibody concentrations for each lab and reference material.

