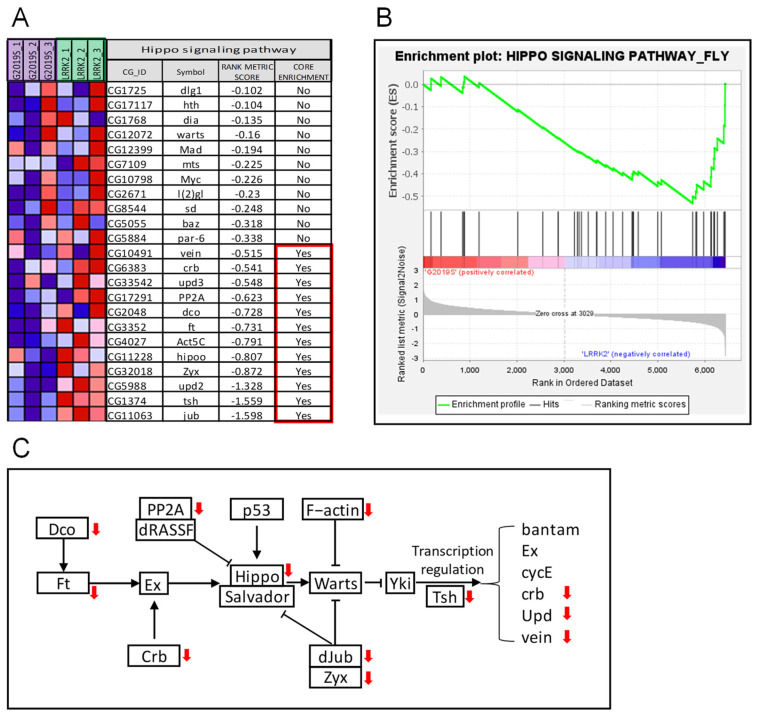
Figure 3.
The Hippo signaling pathway is downregulated in G2019S mutant-overexpressing DA neurons compared to its LRRK2-overexpressing counterparts. (A) Gene expression in the Hippo signaling pathway and rank metric scores. Colors of the squares represent the expression level of the gene, with red for high and blue for low expression, respectively. (B) Enrichment plot of GSEA analysis showing the characteristic downregulation pattern of the Hippo signaling pathway. (C) The roles of downregulated genes in the Hippo signaling pathway. Red arrows denote downregulation in the G2019S-overexpressing DA neurons.

