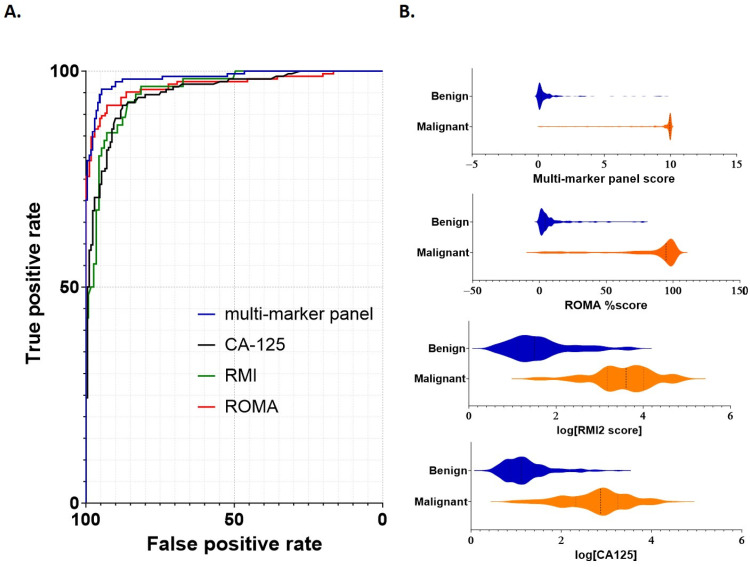
Figure 2.
Performance of individual scoring systems for discrimination between benign and malignant disease. (A) ROC curves were constructed to assess each scoring system (multi-marker panel, CA125, RMI2 and ROMA). Cutoff values for each marker were as follows: multi-marker panel 3.68; CA125 > 35 U/mL, RMI > 200 and ROMA pre-menopausal >13.1% or post-menopausal >27.7%. (B) Violin plots demonstrating comparative scoring across all samples for each scoring system. Sample numbers are as indicated in Table 1 and Table 2.

