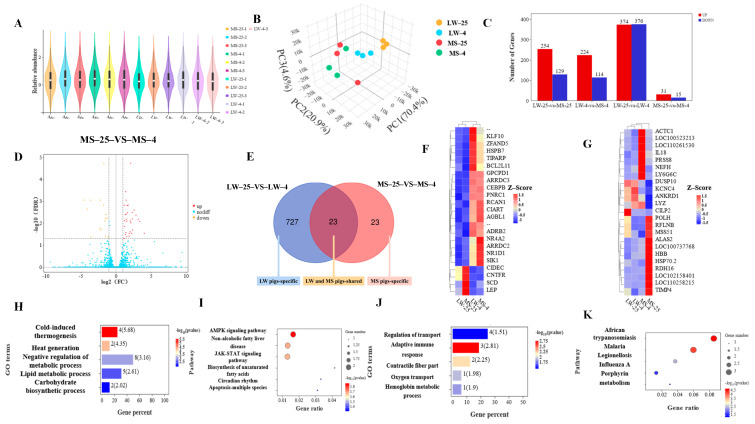
Figure 4.
Transcriptomes of longissimus dorsi muscle in LW and MS pig at 25 °C and 4 °C. (A) Violin plot presenting the distribution of transcriptome sequencing samples from 12 pigs in LW and MS groups. The white dot on the violin plot represents the median, and the quartile range is shown by the black bar above and below the center of the violin. (B) The PCA plot of all 12 samples. (C) Histogram depicting the number of identifiable DEGs between the four groups. (D) Volcanic map highlighting the DEGs between MS-25 and MS-4 groups. (E) Venn diagram illustrating the DEGs shared between the LW pig group and the MS pig group at 25 °C and 4 °C. (F) Heatmap visualizing the DEGs shared in the LW pig group and the MS pig group at 25 °C and 4 °C. (G) Heatmap displaying the specific DEGs between MS-25 and MS-4 groups. (H) Gene ontology (GO) enrichment analysis of DEGs shared in the LW pig group and the MS pig group at 25 °C and 4 °C. (I) Kyoto encyclopedia of genes and genomes (KEGG) pathway classification of DEGs shared in the LW pig group and the MS pig group at 25 °C and 4 °C. (J) GO enrichment analysis of specific DEGs between MS-25 and MS-4 groups. (K) KEGG pathway classification of specific DEGs between MS-25 and MS-4 groups. LW and MS represent Large White pigs and Mashen pigs, respectively; 25 and 4 indicate 25 °C and 4 °C, respectively. The heat map illustrates the relative expression pattern of DEGs between groups, with each column representing a sample and each row representing the expression level of a single mRNA in different samples. The color range of the heat map ranges from blue (low expression) to red (high expression).

