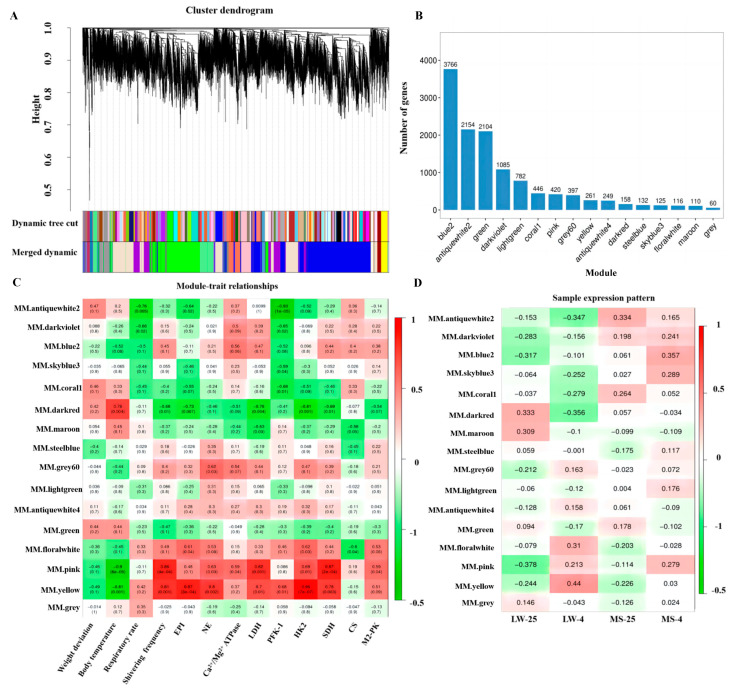
Figure 5.
Weighted co-expression network analysis of all genes. (A) Gene hierarchical clustering partition module. Different colors represent different modules. (B) Histogram showing the number of genes in each module. (C) Correlation analysis between modules and phenotypes. (D) Correlation analysis between modules and groups. The color range of the heat map ranges from green (low expression) to red (high expression). LW and MS represent Large White pigs and Mashen pigs, respectively; 25 and 4 indicate 25 °C and 4 °C, respectively.

