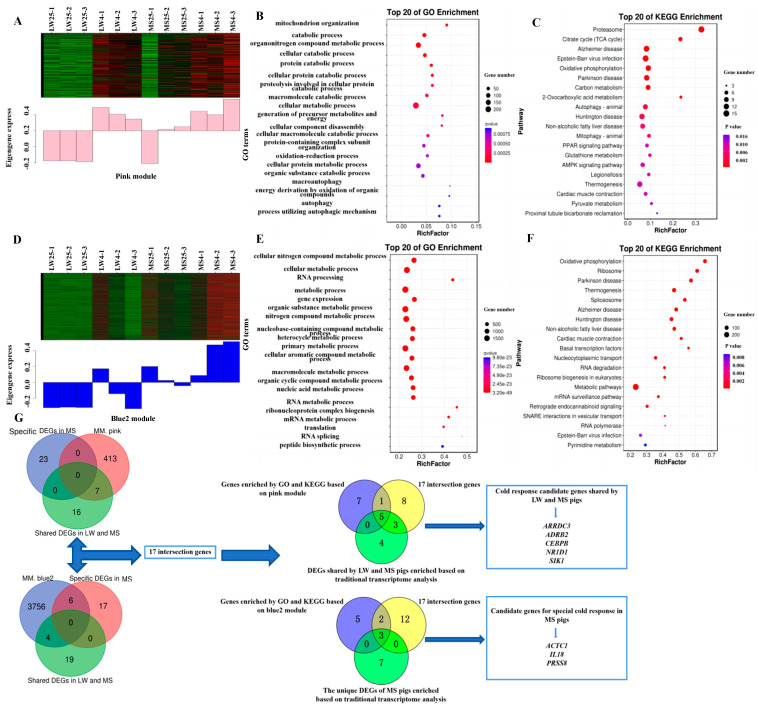
Figure 6.
The expression patterns and functional analysis of genes in the co-expression modules. (A) The expression pattern of genes in the pink module. (B) Gene Ontology (GO) analysis of genes in the pink module. (C) Kyoto Encyclopedia of Genes and Genomes (KEGG) enrichment analysis of genes in the pink module. (D) The expression pattern of genes in the blue2 module. (E) GO analysis of genes in the blue2 module. (F) KEGG enrichment analysis of genes in the blue2 module. (G) Combined results of traditional transcriptomics analysis and weighted co-expression network analysis (WGCNA) to screen common and specific candidate genes responding to cold response in LW and MS pigs. The heat map color scale indicates expression levels, ranging from blue (low expression) to red (high expression). LW and MS denote Large White pigs and Mashen pigs, respectively; 25 and 4 represent 25 °C and 4 °C, respectively.

